Does Cisco's Rally Have Legs?
The tech stock is higher on its latest results and job cuts but let's check the charts to see if there's a sustainable pattern.
You've reached your free article limit
You've read 0 of 1 free Pro articles.
Cisco Systems CSCO is rallying Thursday as the company fiscal fourth-quarter results surpass estimates and it announces plans to cut 7% of workers.
Let's check out the charts and indicators.
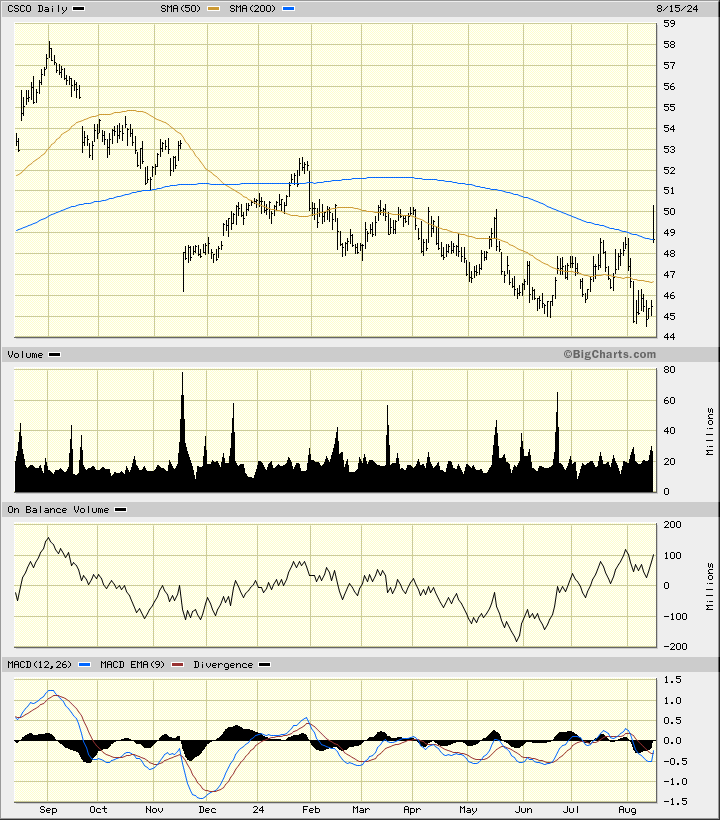
In the daily bar chart of CSCO, below, I can see that prices gapped higher and are trading above both the 50-day moving average line and above the 200-day moving average line.
The On-Balance-Volume (OBV) line turned higher in late May and tells me that buyers have become more aggressive. The Moving Average Convergence Divergence (MACD) oscillator has been below the zero line for more than six months.
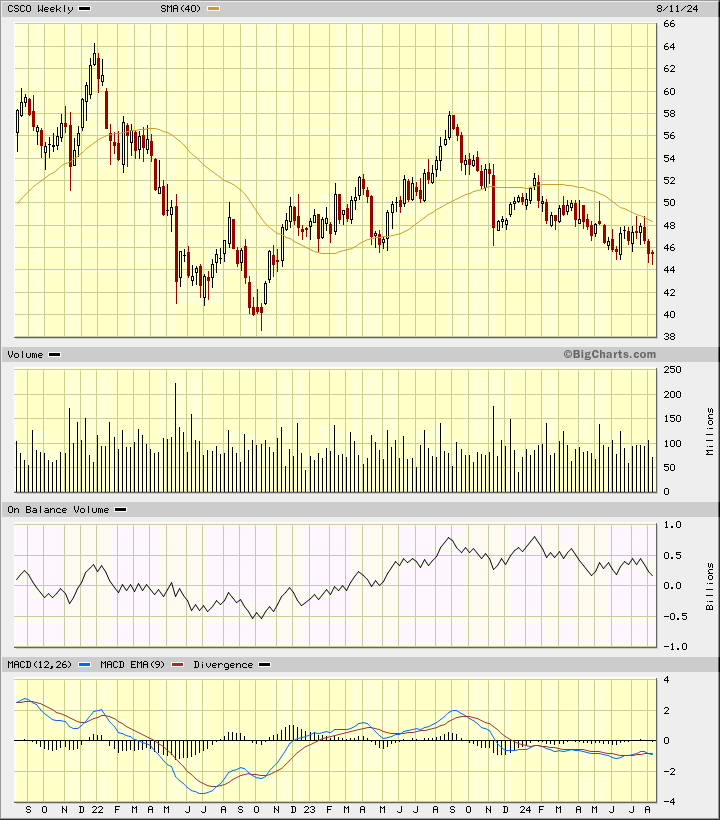
In the weekly Japanese candlestick chart of CSCO, below, I can see that prices have been in a year-long decline before Thursday's rally. We will not know until Friday's close whether CSCO breaks the declining 40-week moving average line.
The OBV line has chopped lower the past year. The MACD oscillator has been below the zero line since December.
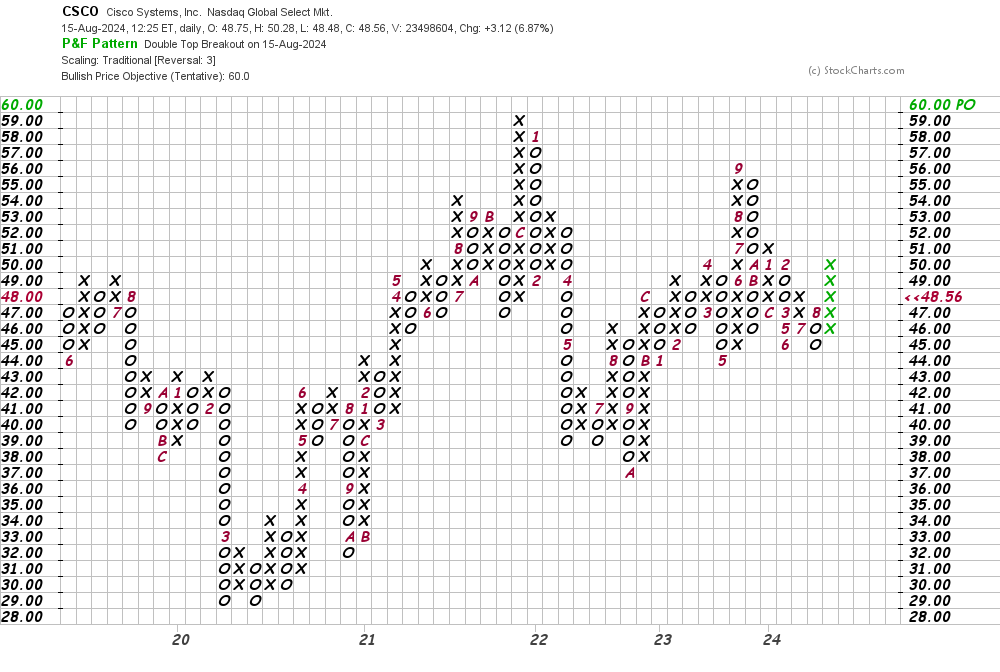
In this daily Point and Figure chart of CSCO, below, I can see an upside price target in the $60 area.
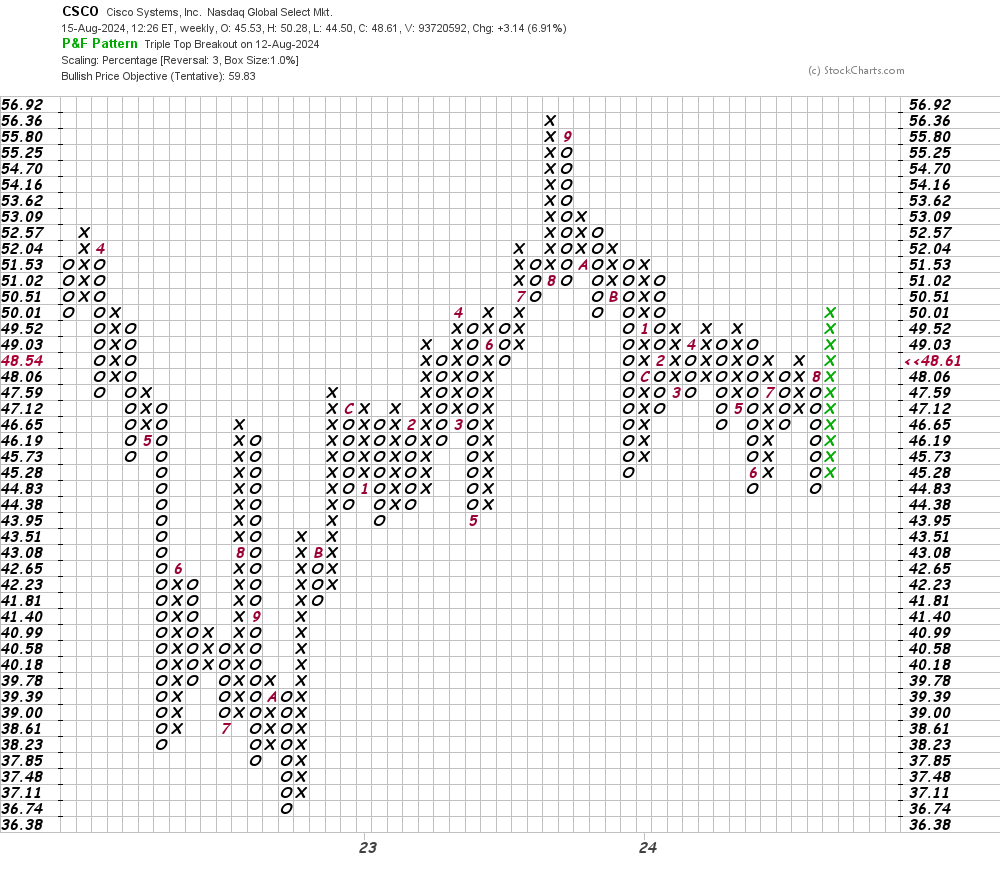
In this weekly Point and Figure chart of CSCO, below, I can see a price target of $60 and on this chart it suggests further gains are possible.
Bottom-line strategy: if I look at the daily bar chart of CSCO with an open mind I can imagine a small bottom in the past three months. I think this bottom needs more development and sideways action. If you want to be a buyer of CSCO, be a patient buyer.
Employees of TheStreet are prohibited from trading individual securities.