DexCom Stock Craters 40% After Earnings: Do the Charts Look Any Better?
Let's assess the damage here.
You've reached your free article limit
You've read 0 of 1 free Pro articles.
Thursday evening DexCom DXCM delivered mixed second-quarter numbers and their full-year revenue forecast fell short of estimates. Non-GAAP EPS of $0.43 beat by $0.04 and revenue of $1 billion which missed by $40 million.
The shares are down 40% (yes, 40%) on Friday morning so let's check the charts and indicators.
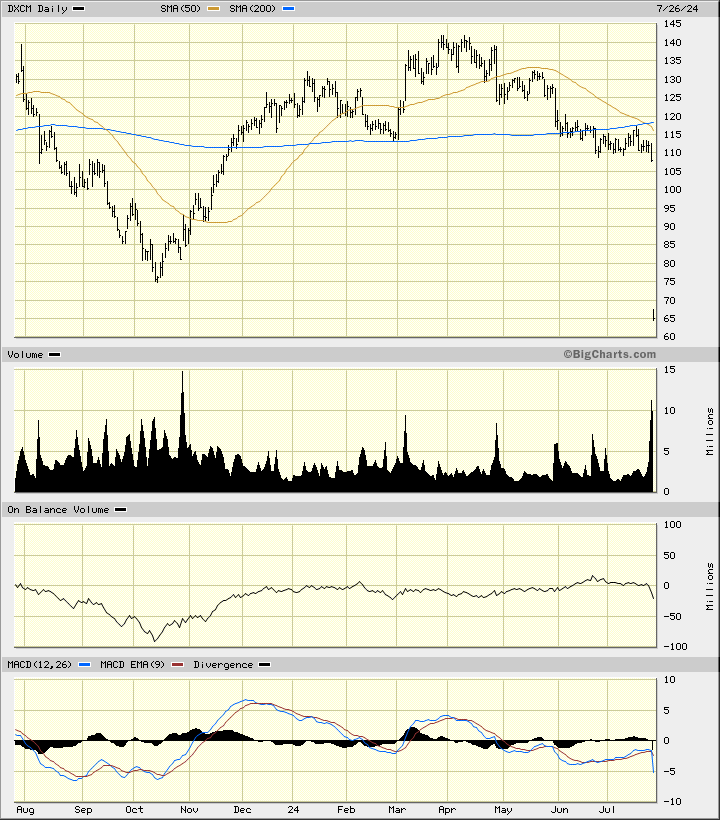
In the daily bar chart of DXCM, below, I can see that the shares made a top reversal pattern from December to May. It is not the biggest head-and-shoulders top pattern I have seen but it is working. Prices have declined to below the cresting 200-day moving average line for another major sell signal. The slope of the shorter 50-day moving average line is negative. If we take the height of the head-shoulders-top and project it lower twice we get a price target in the $65 area.
The On-Balance-Volume (OBV) line finally turned lower in late June to show a shift towards aggressive selling from aggressive buying. The Moving Average Convergence Divergence (MACD) oscillator shows some short-term improvement from June but remains below the zero line.
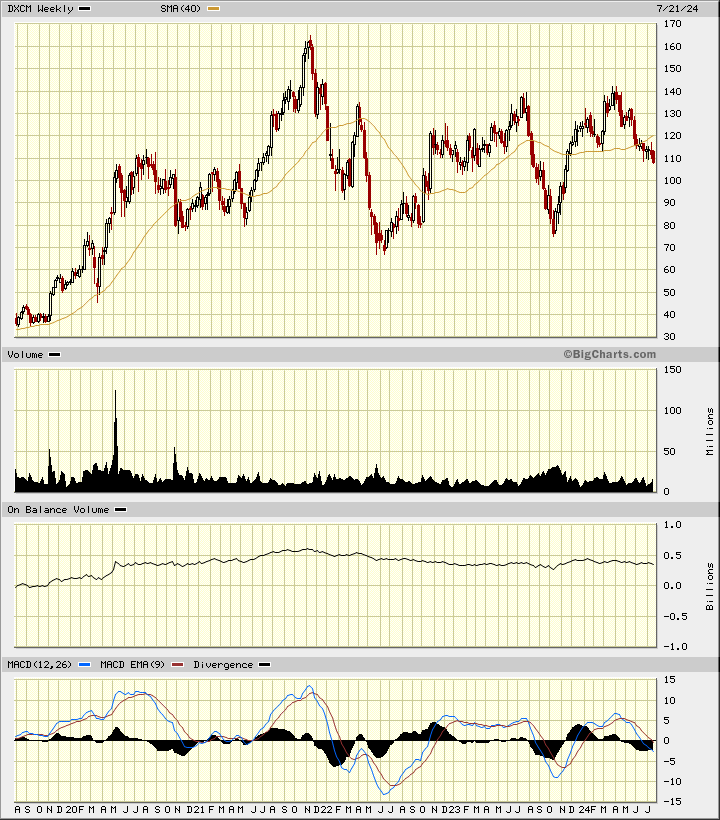
In the weekly Japanese candlestick chart of DXCM, below, I went back five years instead of my standard three-year lookback. I see a bearish picture with the shares trading below the cresting 40-week moving average line.
The weekly OBV line shows weakness the past two years with a secondary downtrend since December to confirms the price weakness we have seen so far. The MACD oscillator has fallen below the zero line for an outright sell signal.
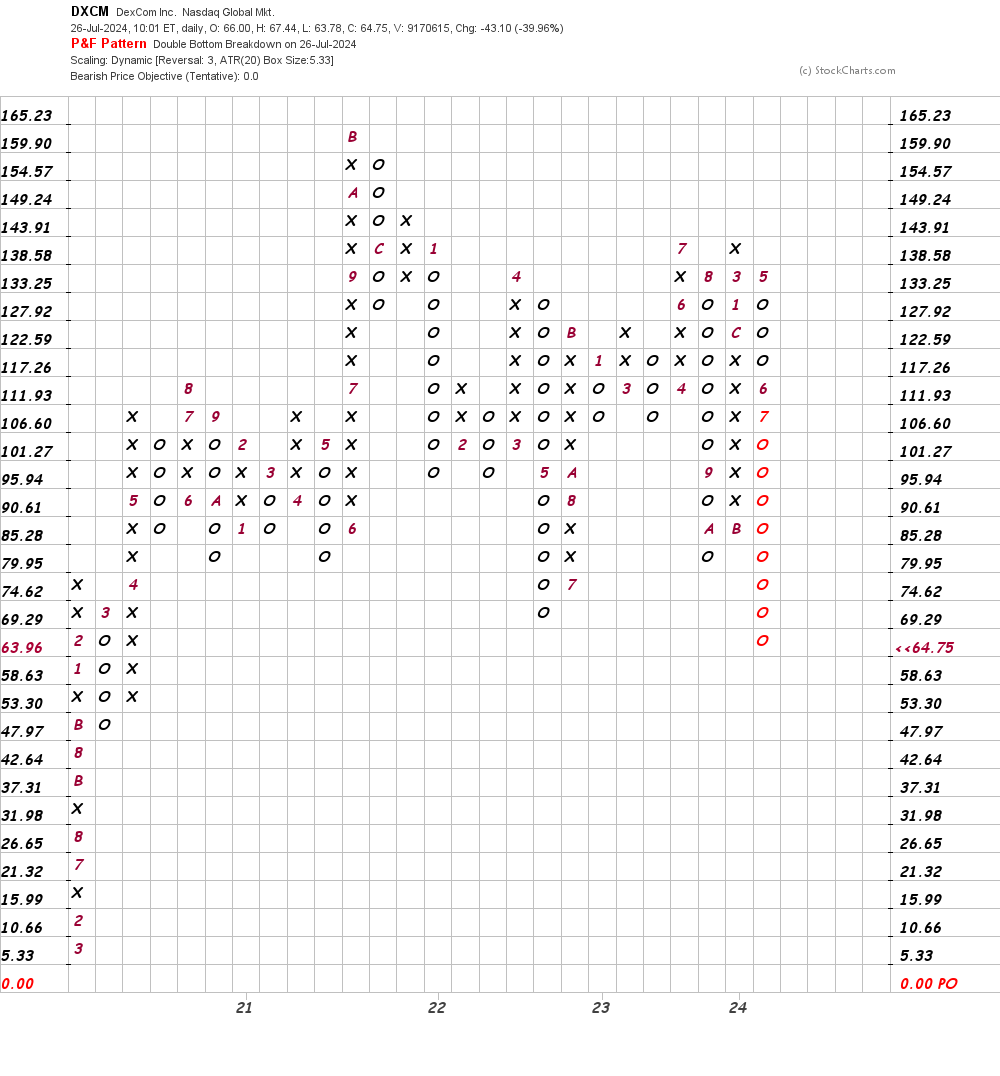
In this daily Point and Figure chart of DXCM, below, I had to do a number of trial and error searches to see what parameters could work. Here I used the Average True Range (ATR) to arrange the data. The software suggests a price target of $0 as in "zero." Pretty extreme. Prices have broken the lows of 2022 so bearish target should be expected.
Bottom-line strategy: In my June 12 review of DXCM I wrote that "I see countless commercials on TV for DexCom's products and diabetes management is a big market but at this point in time the charts of DXCM look vulnerable."
Dexcom's charts have not improved and despite today's sharp decline they still look vulnerable to further losses. Avoid the long side of DXCM.
Employees of TheStreet are prohibited from trading individual securities.