These Positions Can Help Traders Profit From Copper Gains
As demand for the metal increases, we're reviewing the price charts for a pair of copper positions and offering a strategy.
You've reached your free article limit
You've read 0 of 1 free Pro articles.
Some traders like to follow the investments of Warren Buffett, George Soros or David Tepper. I have followed the investments of Stanley Druckenmiller for many years.
You might ask why.
It's simply because Druckenmiller lays out his ideas clearly and uses technical analysis as part of his decision-making strategy. Druckenmiller has always had a risk level in mind when he enters an investment and in managing it as things evolve. With that in mind, I want to explore two positions.
Druckenmiller has been quoted in various forums as being bullish on copper prices as he sees that prices are set to rise over the next five or six years as demand outpaces supply. Demand for production of EVs, data centers and missiles are ramping up. Let's check out the charts of copper futures and one miner favored by Druckenmiller, Freeport-McMoRan FCX.
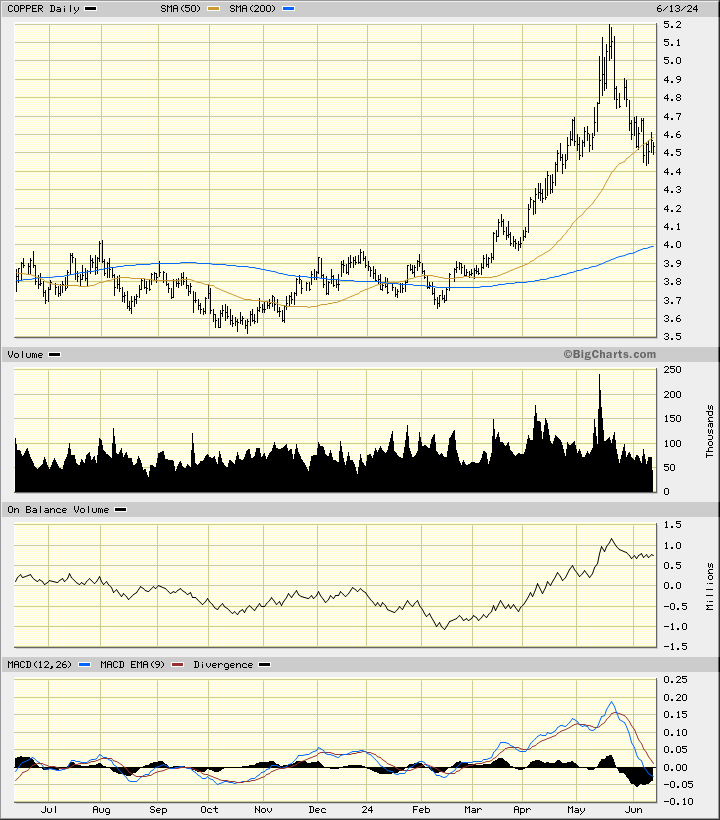
In this daily bar chart of the continuous futures contract of copper below, I can see that prices have been pulling back over the past four weeks, correcting the prior strength from February to May. Trading volume has been increasing since February and tells me that more traders and hedgers are being attracted to the market.
Producers will be looking to sell rallies in the futures to lock in selling prices and users of the metal will be looking to establish purchase prices. Speculators are attracted by trends in either direction. The slopes of the 50-day moving average line and the 200-day moving average line are both positive. The On-Balance-Volume (OBV) line has pulled back from its rise into the middle of May. The Moving Average Convergence Divergence (MACD) oscillator has corrected down to the zero line.
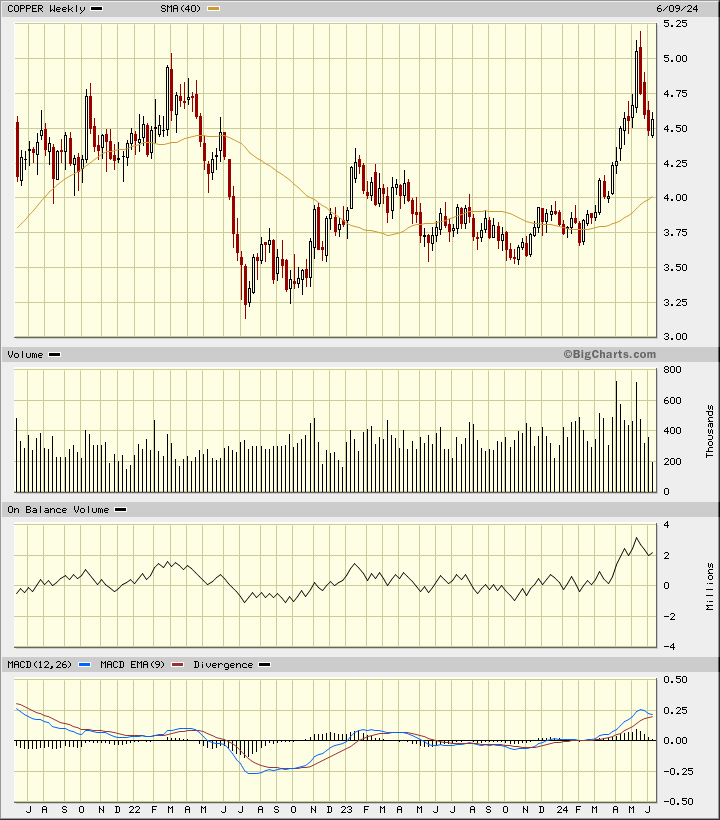
In this weekly Japanese candlestick chart of copper futures below, I see a chart that shows it is capable of further gains. Prices have corrected for three weeks with red (bearish) candles and the most recent candle in white (bullish). The trading volume has increased for several months and shows a decline in volume on the recent pullback. A light volume pullback is bullish as it suggests that traders are largely staying with their positions. The weekly OBV line shows a small dip and the MACD oscillator has narrowed toward a possible take-profit sell signal.
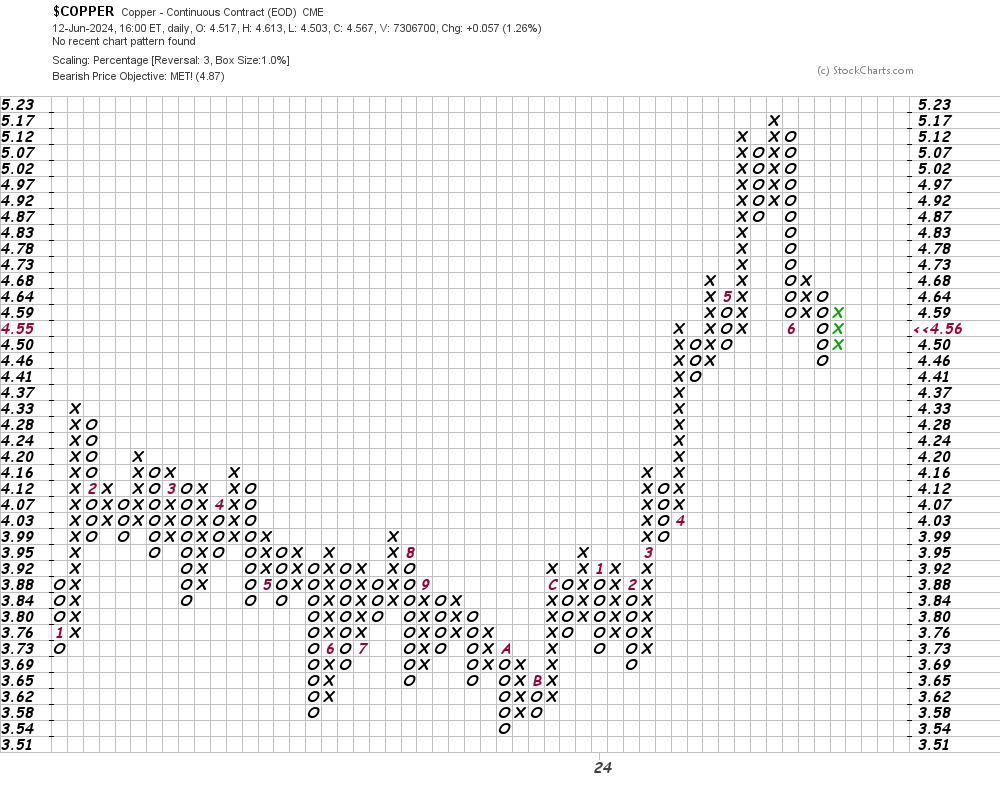
In this daily Point and Figure chart of copper futures below, I can see that prices have reached a downside price target in the $4.87 area.
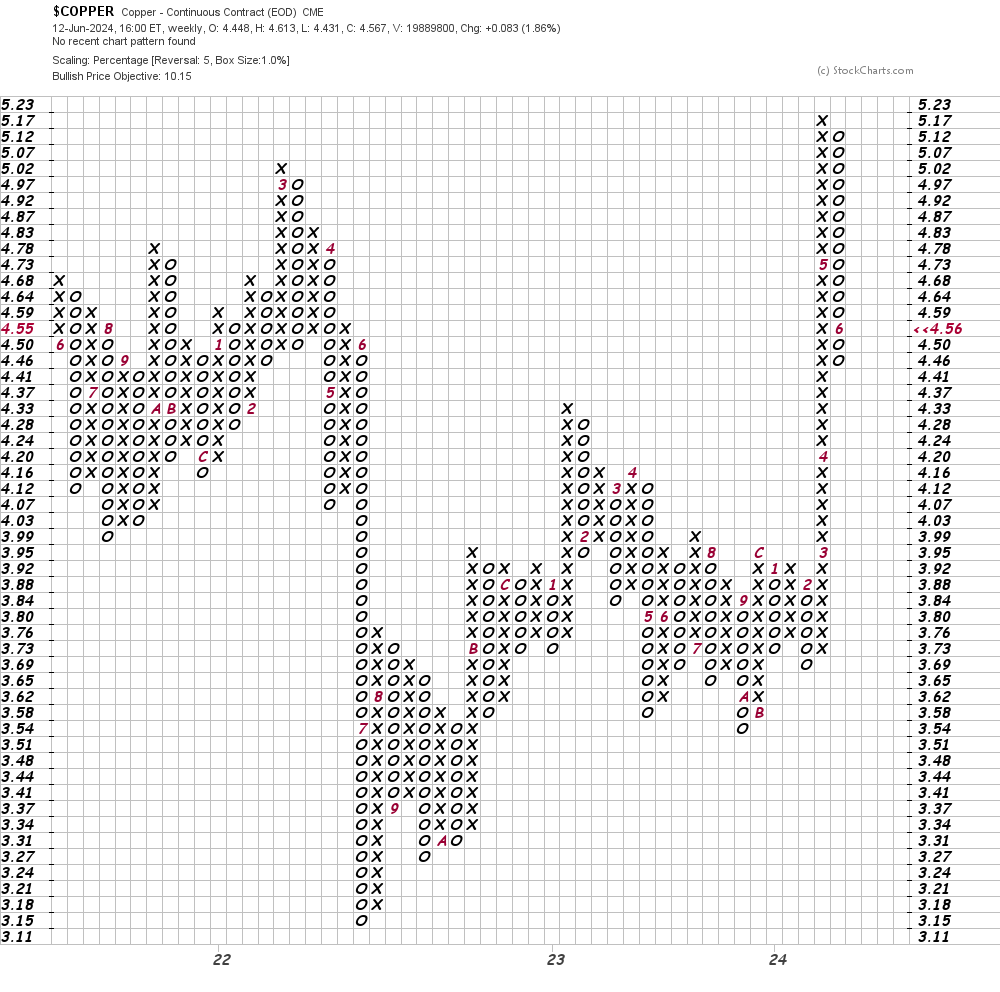
In this weekly Point and Figure chart of copper futures below, I used a five-box reversal filter. Here, the software suggests a price target of $10.15. Impressive.
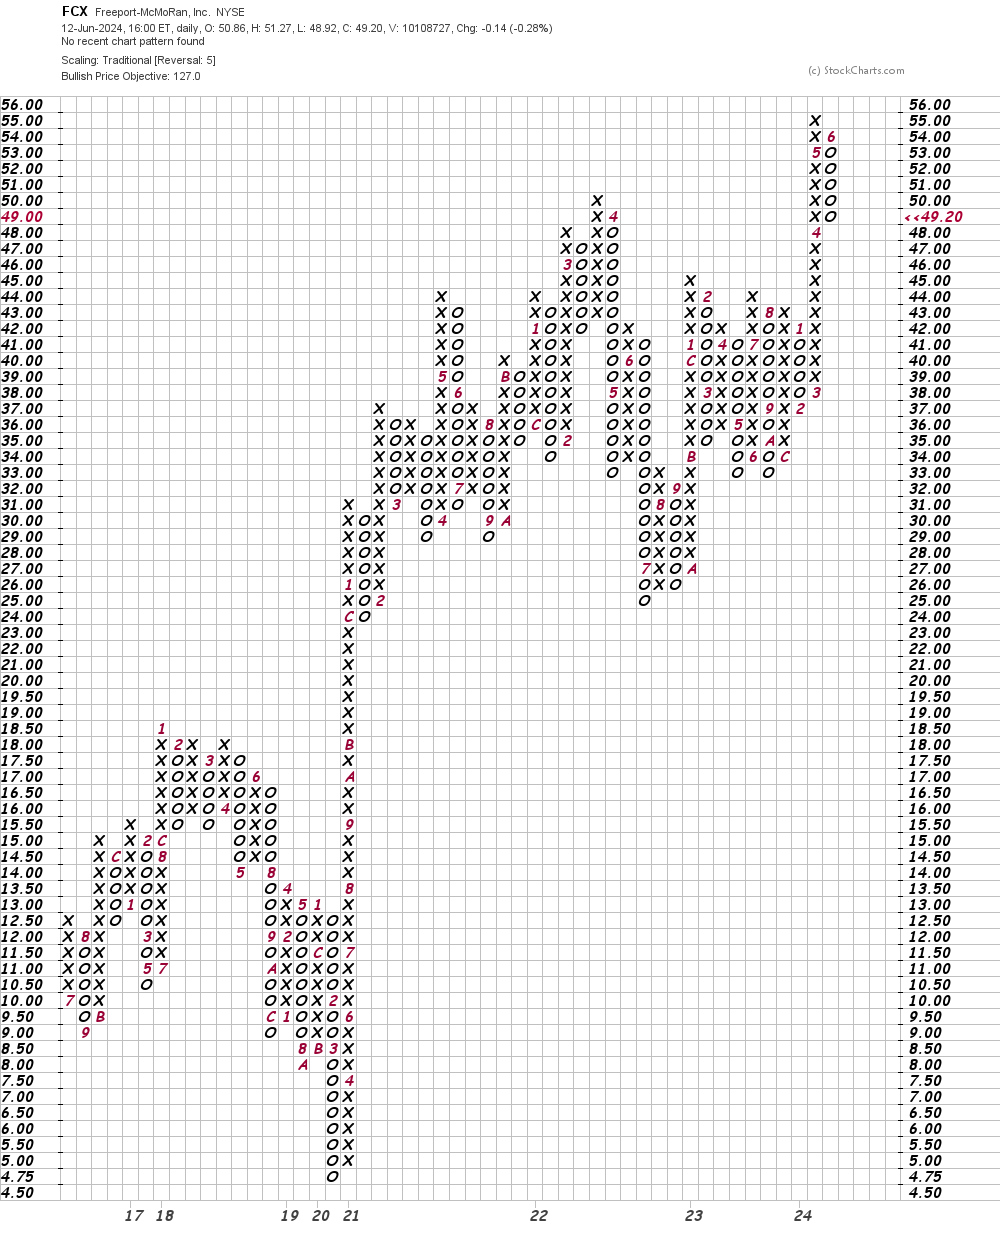
In this daily Point and Figure chart of FCX below, I used a five-box reversal filter. Here, the software suggests a price target of $127 is possible.
Bottom line strategy: Why do people follow some high-profile investors? Because they have been successful? Sure. But I think it is because they do their research and have better sources of information and a strategy.
Traders who have followed our recommendations should continue to hold those positions.
Employees of TheStreet are prohibited from trading individual securities.