Constellation's Charts Not Stirred by Mixed Earnings
Now, beer sales could help the price target bubble higher.
You've reached your free article limit
You've read 0 of 1 free Pro articles.
Constellation Brands STZ reported mixed first-quarter results this Wednesday morning, but reaffirmed its outlook. Shares are trading higher as if champagne bottles have been opened. STZ missed sales estimates by $10 million, but posted a beat on EPS of $3.57 vs. estimates of $3.46. Beer net sales rose 8%.
Let's check out the charts and indicators.
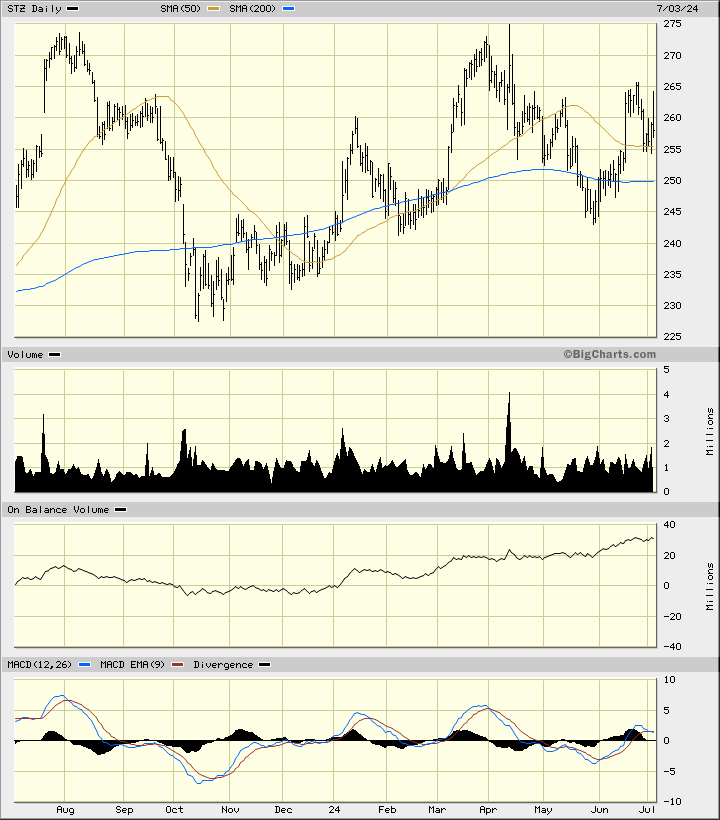
In this daily bar chart of STZ, below, I can see that prices surged in early turnover Wednesday but have given up some of those early gains. Prices are trading above the bottoming 50-day moving average line and above the bottoming 200-day moving average line.
The On-Balance-Volume (OBV) line has been rising since December and tells me that buyers of STZ have been more aggressive than sellers. The trend-following Moving Average Convergence Divergence (MACD) is slightly above the zero-line.
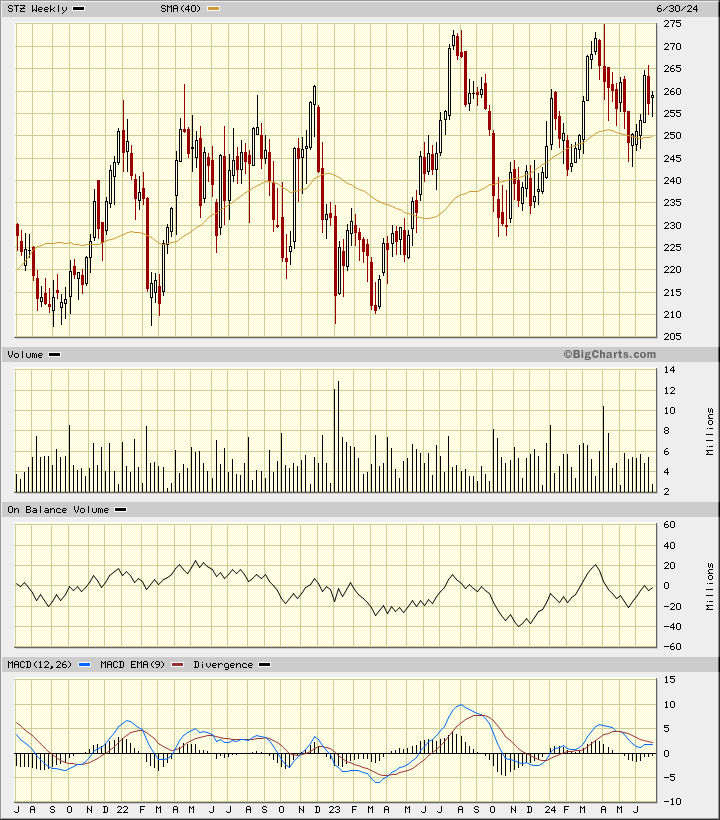
In this weekly Japanese candlestick chart, below, I can see that prices have made higher-lows since early 2023. The 40-week moving average line now has a positive slope. The weekly OBV line shows gains since November. The MACD oscillator is above the zero-line and trying for an upside crossover.
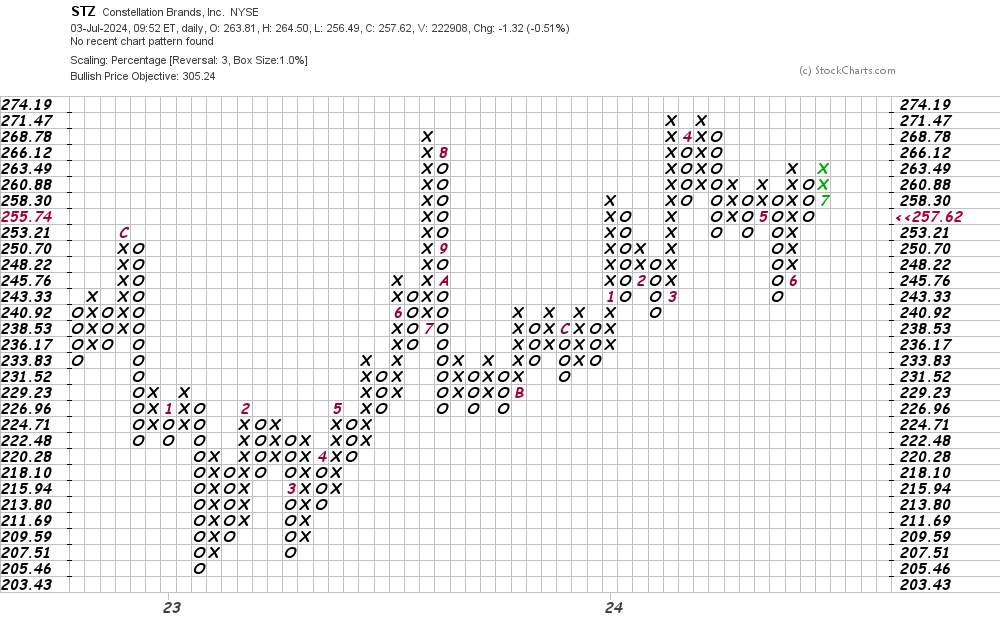
In this daily Point and Figure chart of STZ, below, I can see a potential upside price target in the $305 area.
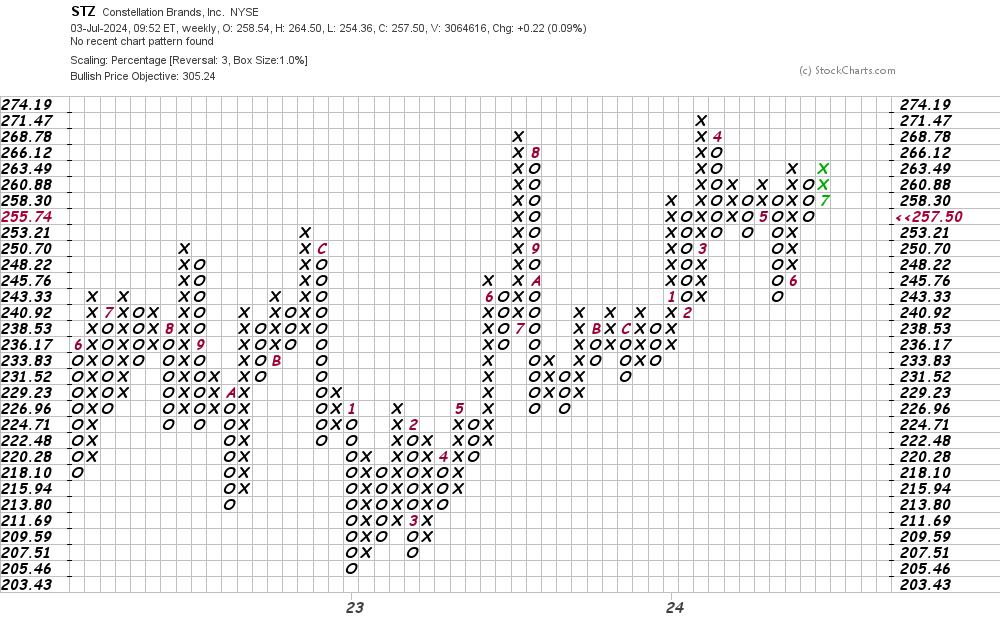
In this weekly Point and Figure chart of STZ, below, I can also see the $305 price target that is shown on the daily chart above.
Bottom line strategy: Should we check the long-range weather reports? Beer has really helped the company's results and in my opinion hot and humid days are a boon to beer sales.
Just saying.
Traders could go long STZ on strength above $274, which will be a breakout on the Point and Figure charts.
Employees of TheStreet are prohibited from trading individual securities.