Coherent Stock Is Laser Focused on More Upside
The shares have more than doubled since early November. Here's what the current charts and indicators are telling us.
You've reached your free article limit
You've read 0 of 1 free Pro articles.
Coherent Corp. COHR is in the laser business and its share price has more than doubled since early November.
Let's check out the charts and indicators to see if things will remain on course.
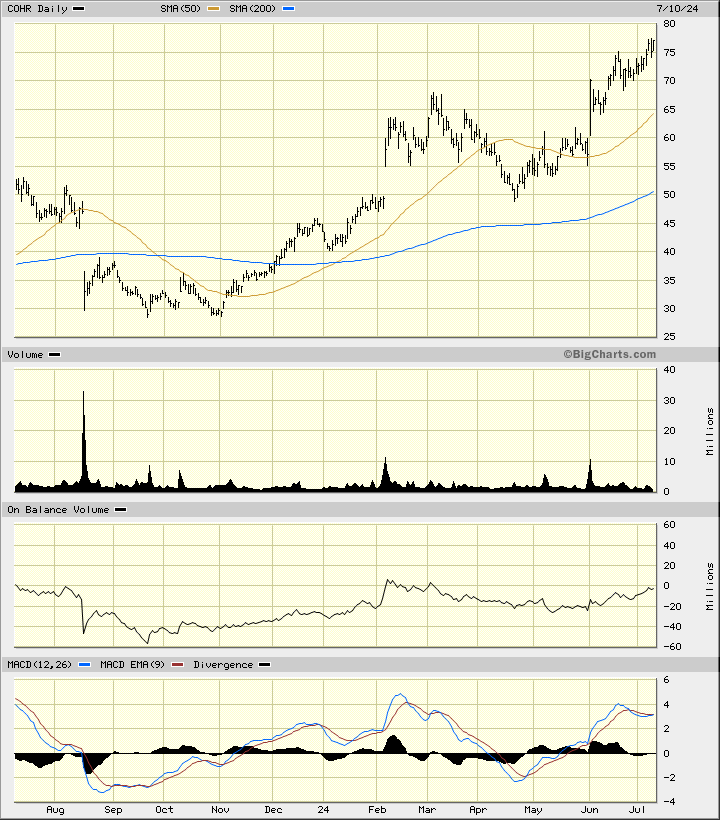
In the daily bar chart of COHR, below, I can see that the shares have made a strong advance with a correction in March and April. Prices have resumed their upward path and trade above the rising 50-day moving average line and above the rising 200-day line.
The On-Balance-Volume (OBV) line has mirrored the price action and is close to making a new high of its own. The Moving Average Convergence Divergence (MACD) oscillator is above the zero line and looks poised for a fresh buy signal.
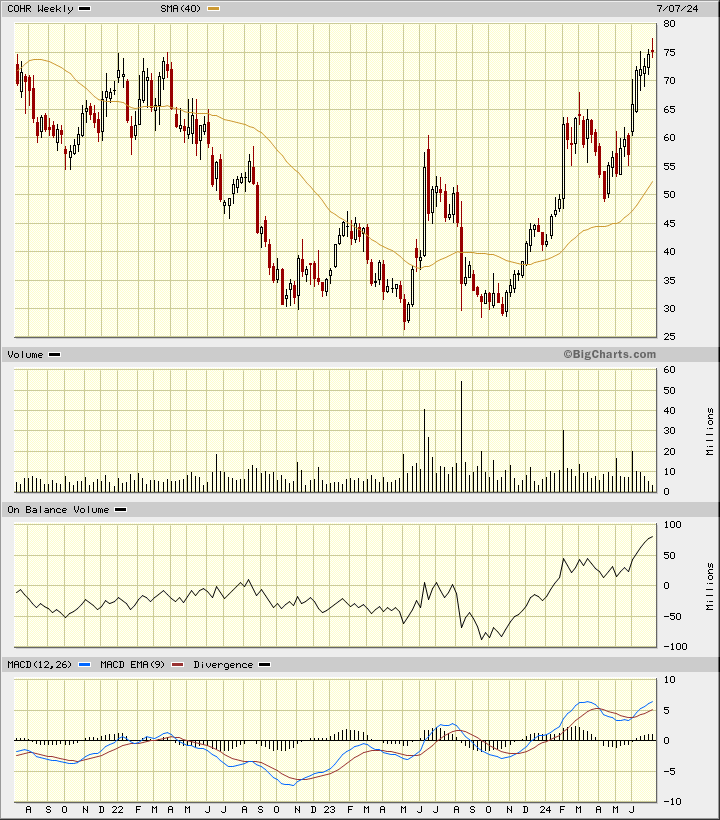
In the weekly Japanese candlestick chart of COHR, below, I see a positive setup. Prices made a base pattern in 2023 and have powered higher.
Trading volume has increased. The weekly OBV line has been very strong and the MACD oscillator is bullish. An upper shadow on the most recent candle pattern needs to be watched closer as it suggests that traders have rejected the highs.
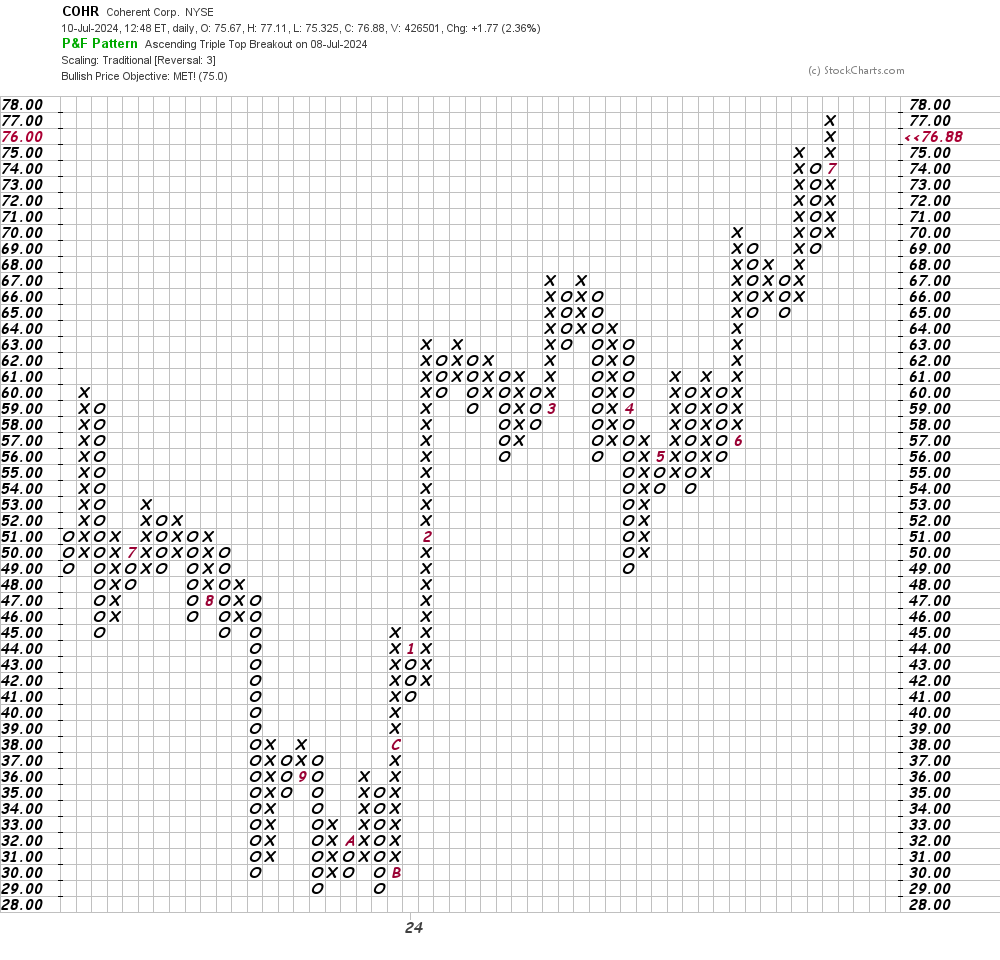
In this daily Point and Figure chart of COHR, below, I can see that prices reached a price target in the $75 area.
In this weekly Point and Figure chart of COHR, below, I can see a price target in the $113 area.
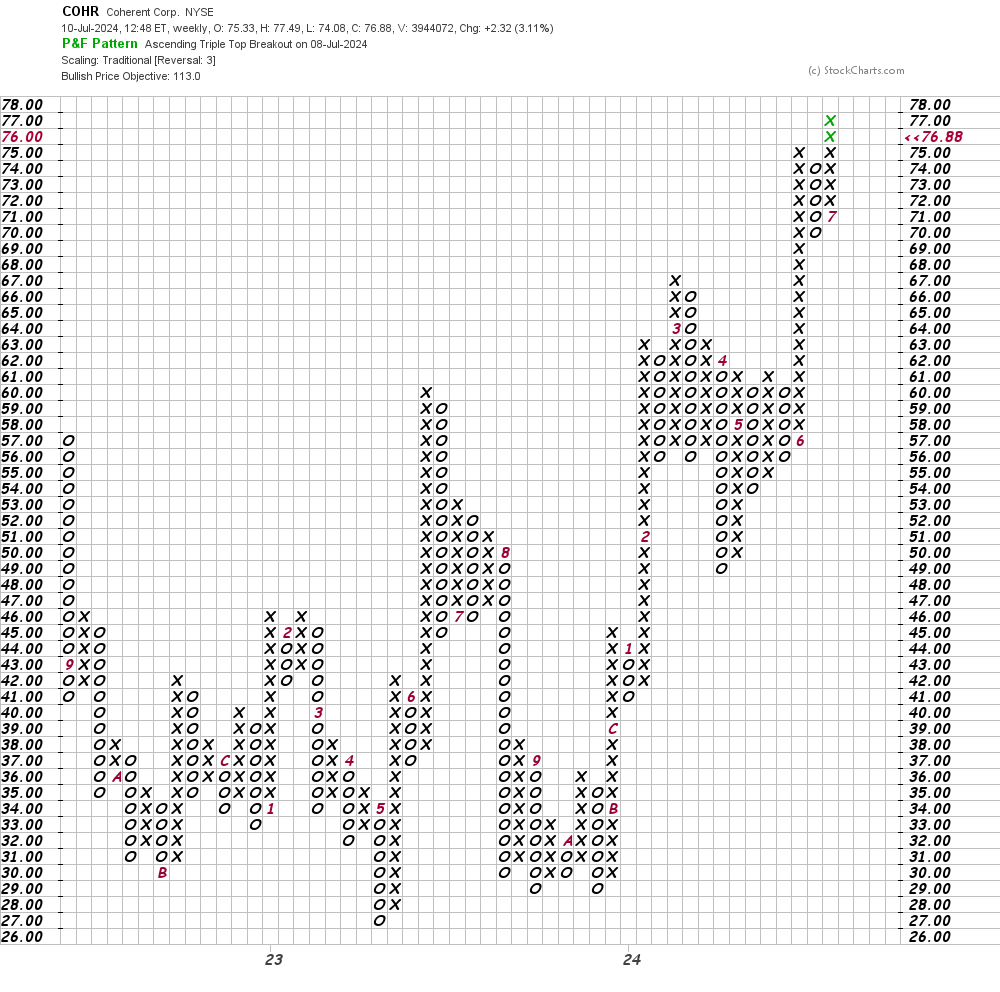
Bottom-line strategy: Aggressive traders could go long COHR around $75 risking to $66. The $113 area is my price target.
Employees of TheStreet are prohibitied from trading individual securities.