A Singularly American Brand Looks Poised for a Price Breakout
Traders might go long on an iconic beverage brand, based on chart indicators.
You've reached your free article limit
You've read 0 of 1 free Pro articles.
I cannot think of a more "American brand" than Coca-Cola Co. (KO), can you? Let's check out the charts of KO.
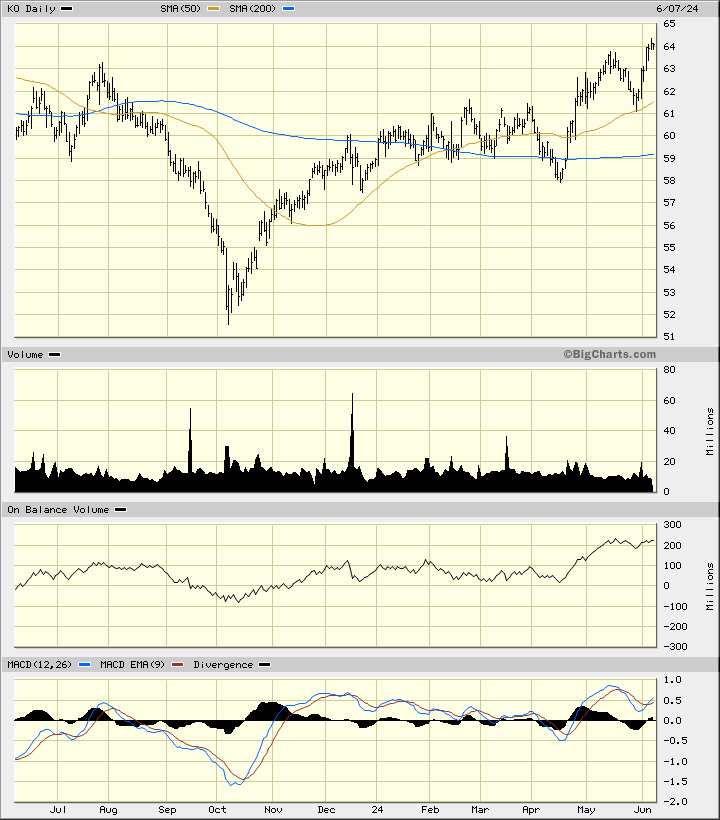
In this daily bar chart of KO below, I can see that prices have trended higher since a V-bottom in October. Prices trade above the rising 50-day moving average line and above the bottoming 200-day moving average line. The On-Balance-Volume (OBV) line has worked higher from a low in October. The Moving Average Convergence Divergence (MACD) oscillator is above the zero line.
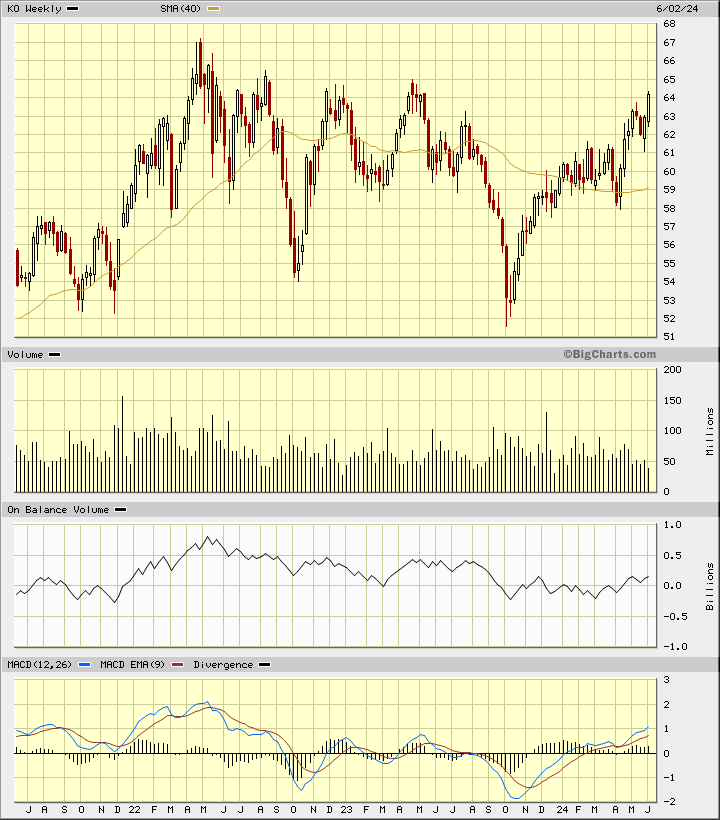
In this weekly Japanese candlestick chart of KO below, I can see a broad sideways trend playing out over the past three years. The way the indicators and candles line up, I suspect we could see an upside price breakout on KO. Prices are trading above the bottoming 40-week moving average line. The weekly OBV line has been bottoming since October. The MACD oscillator is in a bullish alignment above the zero line.
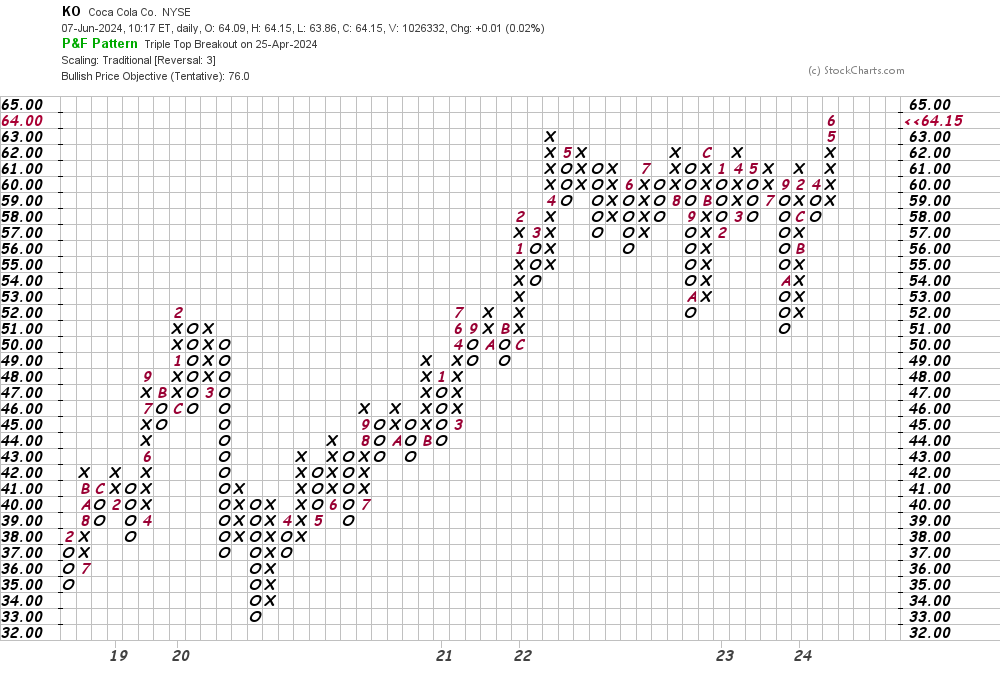
In this daily Point and Figure chart of KO below, I can see an upside breakout on this kind of chart. The software is projecting a price target in the $76 area.
In this weekly Point and Figure chart of KO below, I have a lot of price history. Here too I can see the same $76 price target.
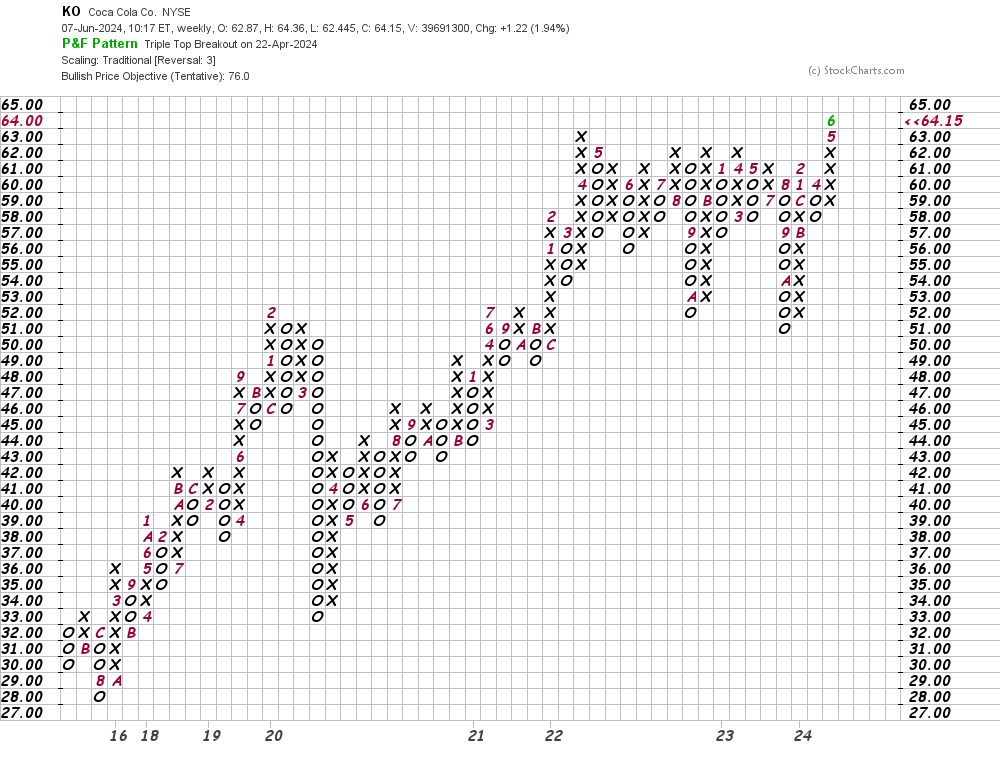
Bottom line strategy: With or without rum, traders could go long KO at current levels, risking to $60.50. The $76 area is my price target for now.
Employees of TheStreet are prohibited from trading individual securities.