Checking Under the Hood of O'Reilly Automotive Ahead of Earnings
Let's see what the charts and indicators look like.
You've reached your free article limit
You've read 0 of 1 free Pro articles.
O’Reilly Automotive ORLY is scheduled to report their latest earnings figures to shareholders after the close of trading Wednesday. Let's check out the charts and indicators to see if we need a tune-up or if things will rev higher.
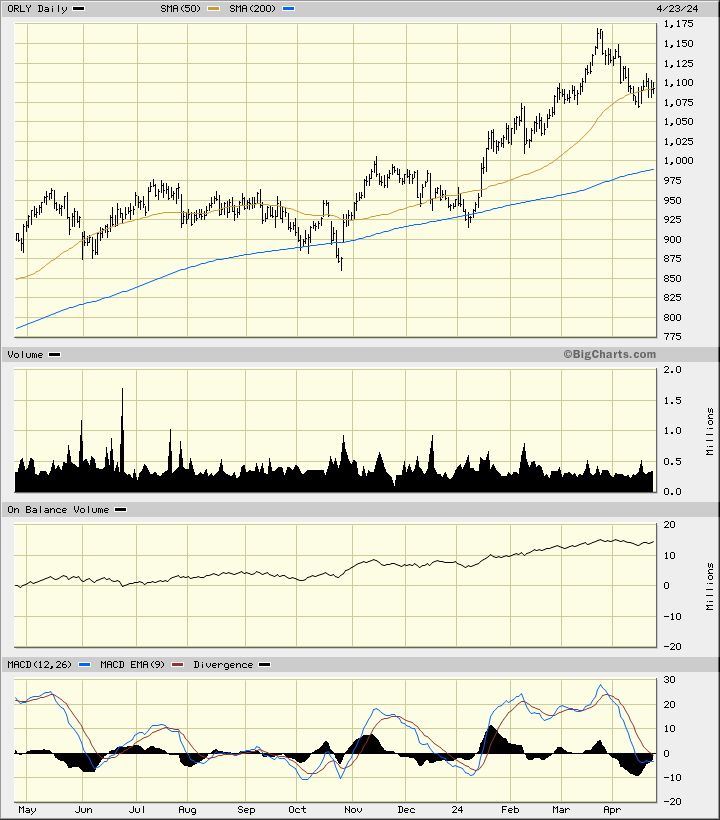
In this daily bar chart of ORLY, below, I can see a rising trend over the past year. Prices have pulled back recently to retest the 50-day moving average line but ORLY is clearly trading above the rising 200-day moving average line.
The trading volume has been steady over the past twelve months and the On-Balance-Volume (OBV) line shows a rising pattern telling me that buyers of ORLY have been more aggressive than sellers.
The trend-following Moving Average Convergence Divergence (MACD) oscillator recently moved below the zero line for an outright sell signal.
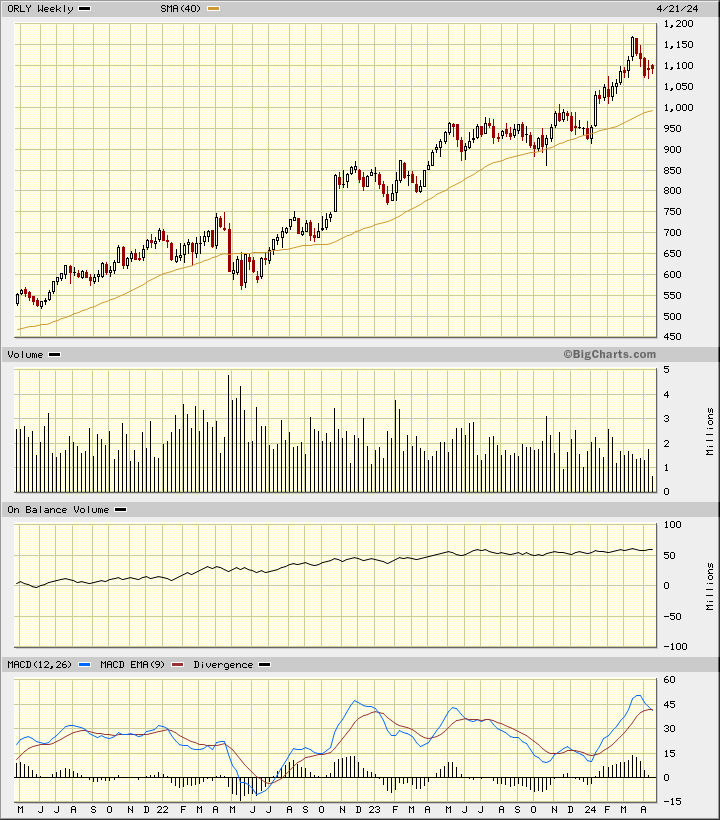
In this weekly Japanese candlestick chart of ORLY, below, I can see that prices have more than doubled in the past three years. ORLY trades above the rising 40-week moving average line and declines to and just below the line have turned out to be buying opportunities. The weekly trading volume has been slowly declining the past two years.
The OBV line has gradually moved higher to confirm the price gains. The MACD oscillator is above the zero line but has weakened in recent weeks. The two most recent candle patterns have lower shadows so traders have started to reject the lows tilting the odds towards a rally ahead.
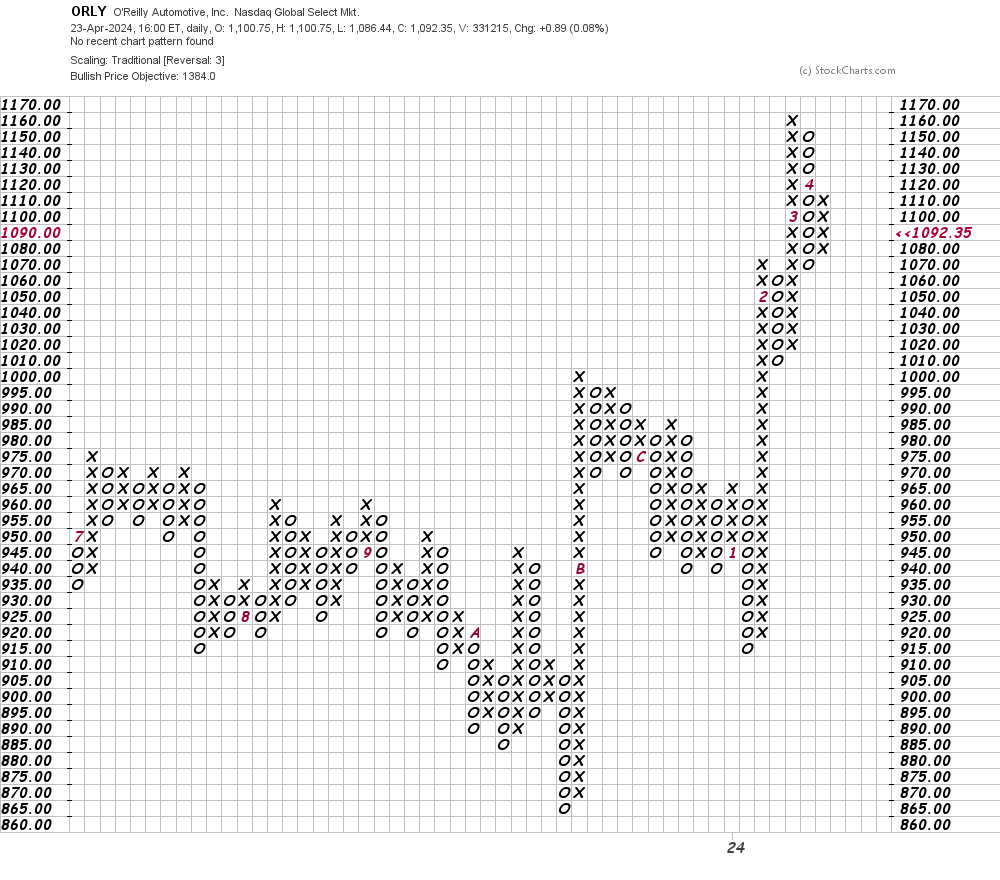
In this daily Point and Figure chart of ORLY, below, I can see a potential upside price target in the $1,384 area.
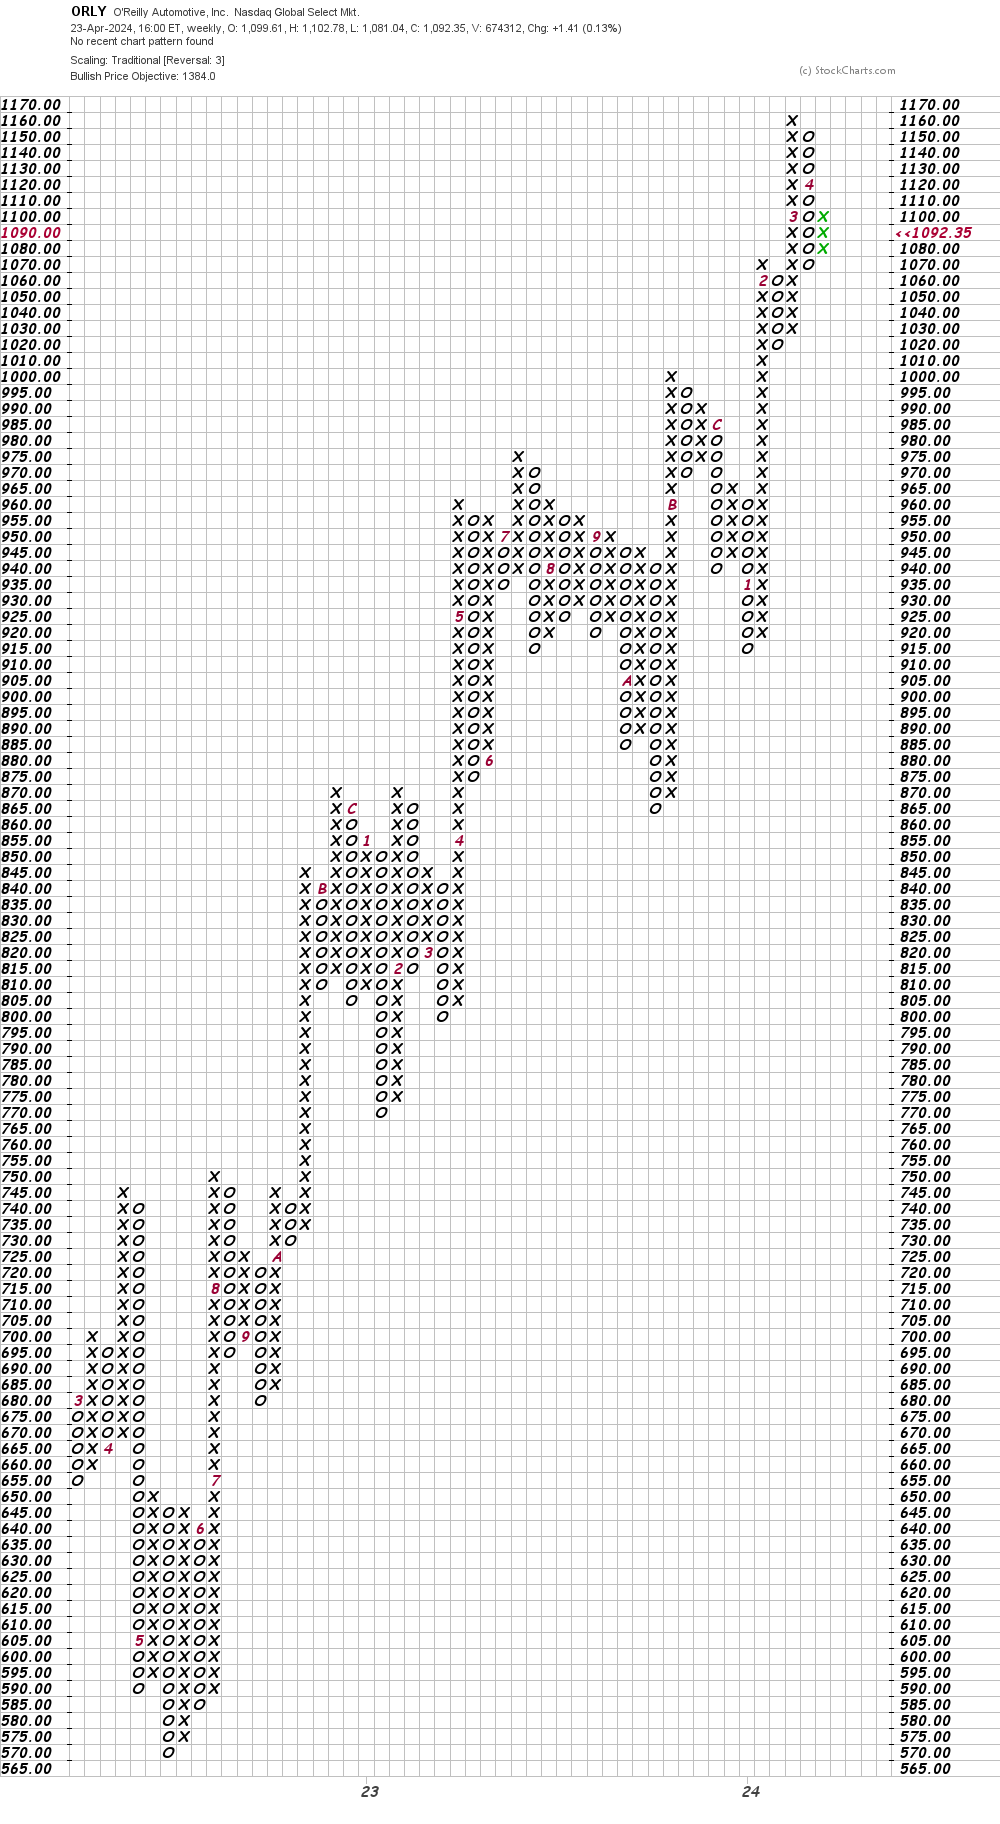
In this weekly Point and Figure chart of ORLY, below, I can see a price target in the $1,384 area - the same as the daily chart above.
Bottom line strategy: I have no special knowledge of what ORLY will tell shareholders this evening, but the charts and indicators are generally supportive. Traders who are long ORLY should raise stops to $1,050.
Employees of TheStreet are prohibited from trading individual securities.