Cassava Sciences' Charts Were Bad Enough Before Feds Probed Scientist
Even before Friday's news, SAVA was moving in the wrong direction for investors.
You've reached your free article limit
You've read 0 of 1 free Pro articles.
Cassava Sciences SAVA plunged sharply on Friday, after a federal indictment of a lead scientist working as an adviser for Cassava Sciences on the company's Alzheimer’s drug. The drug is in late-stage clinical trials.
Let's check out the charts and indicators for clues.
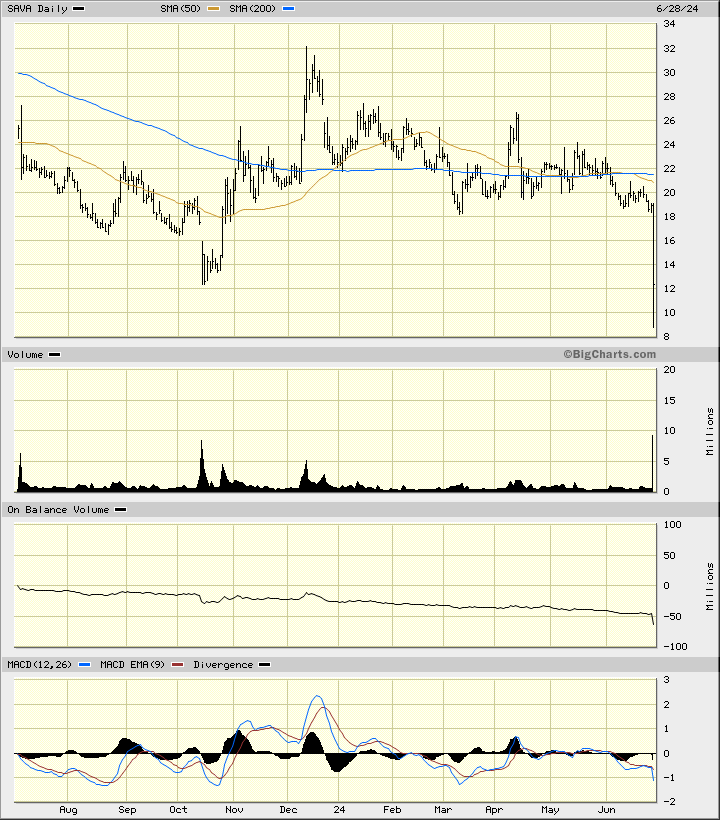
In this daily bar chart of SAVA, below, I can see that prices traded sideways to lower for months before plunging on Friday. SAVA was trading below the declining 50-day moving average line and below the declining 200-day moving average line before Friday's plunge. The trading volume has been hard to read but the daily On-Balance-Volume (OBV) line has been in a downward path the last year suggesting that sellers of SAVA have been more aggressive than buyers for months before Friday's sharp decline.
The Moving Average Convergence Divergence (MACD) oscillator is in a bearish alignment below the zero-line.
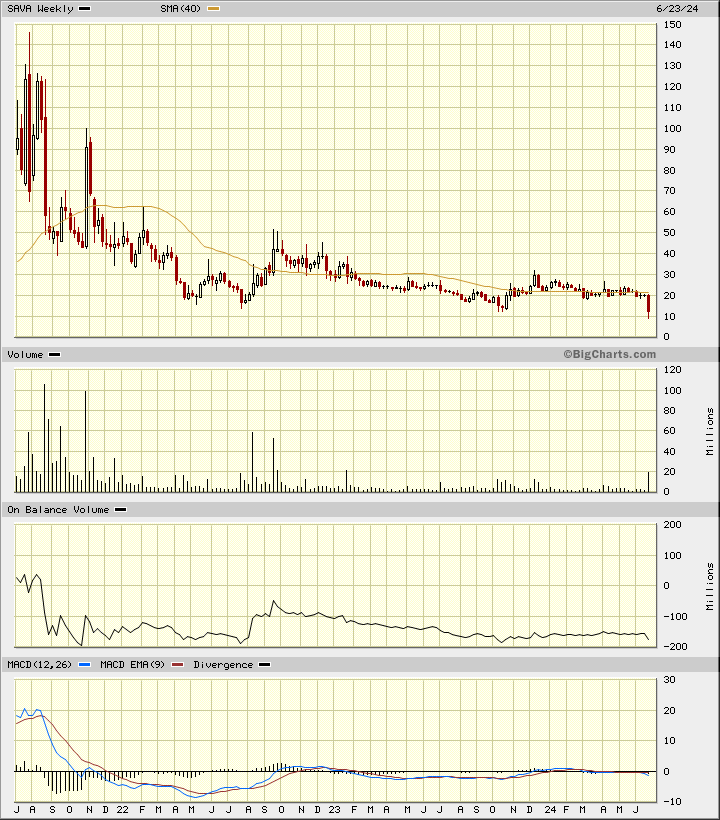
In this weekly Japanese candlestick chart of SAVA, below, I can see a longer-term decline that is still in progress. The slope of the 40-week moving average line is negative. The weekly OBV line is bearish and so is the moving average convergence/divergence oscillator.
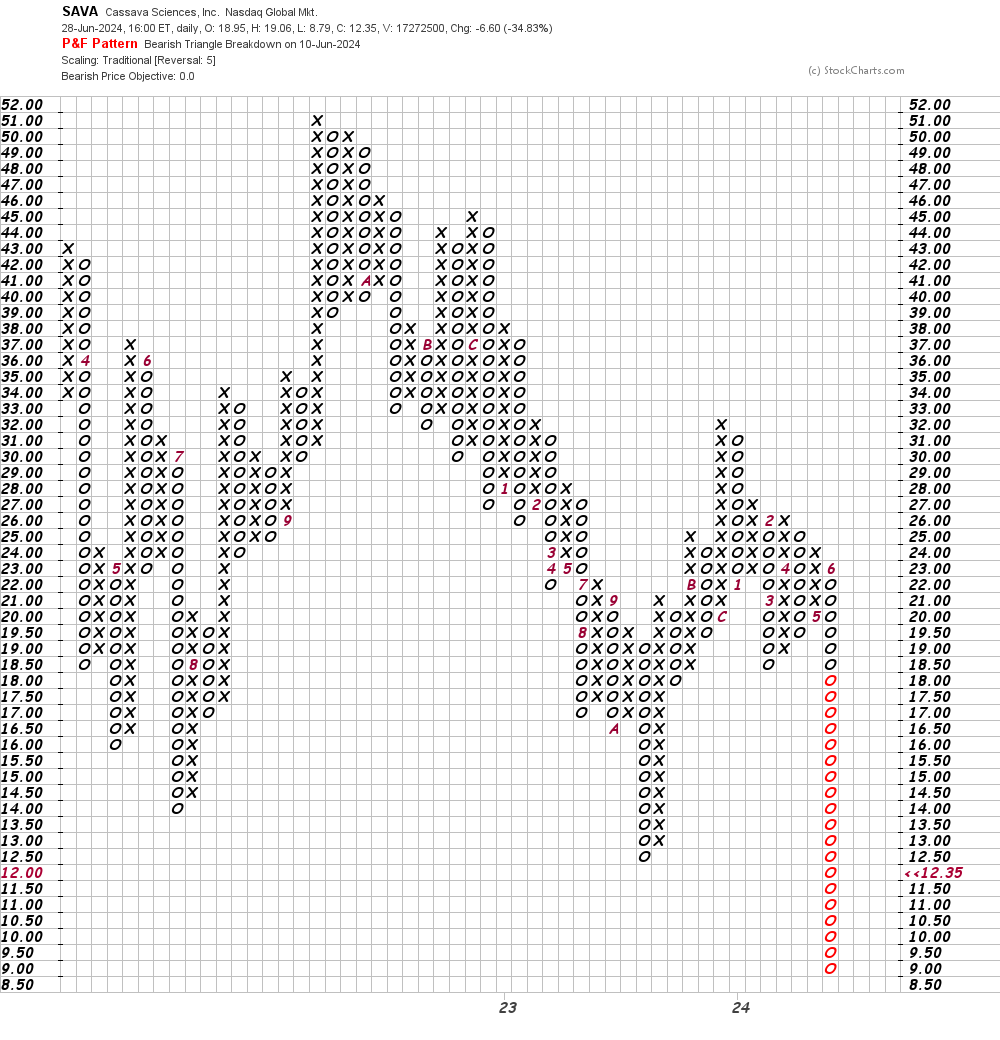
In this daily Point and Figure chart of SAVA, below, I used a five box reversal filter. Here the software suggests a price target of $0. Who knows?
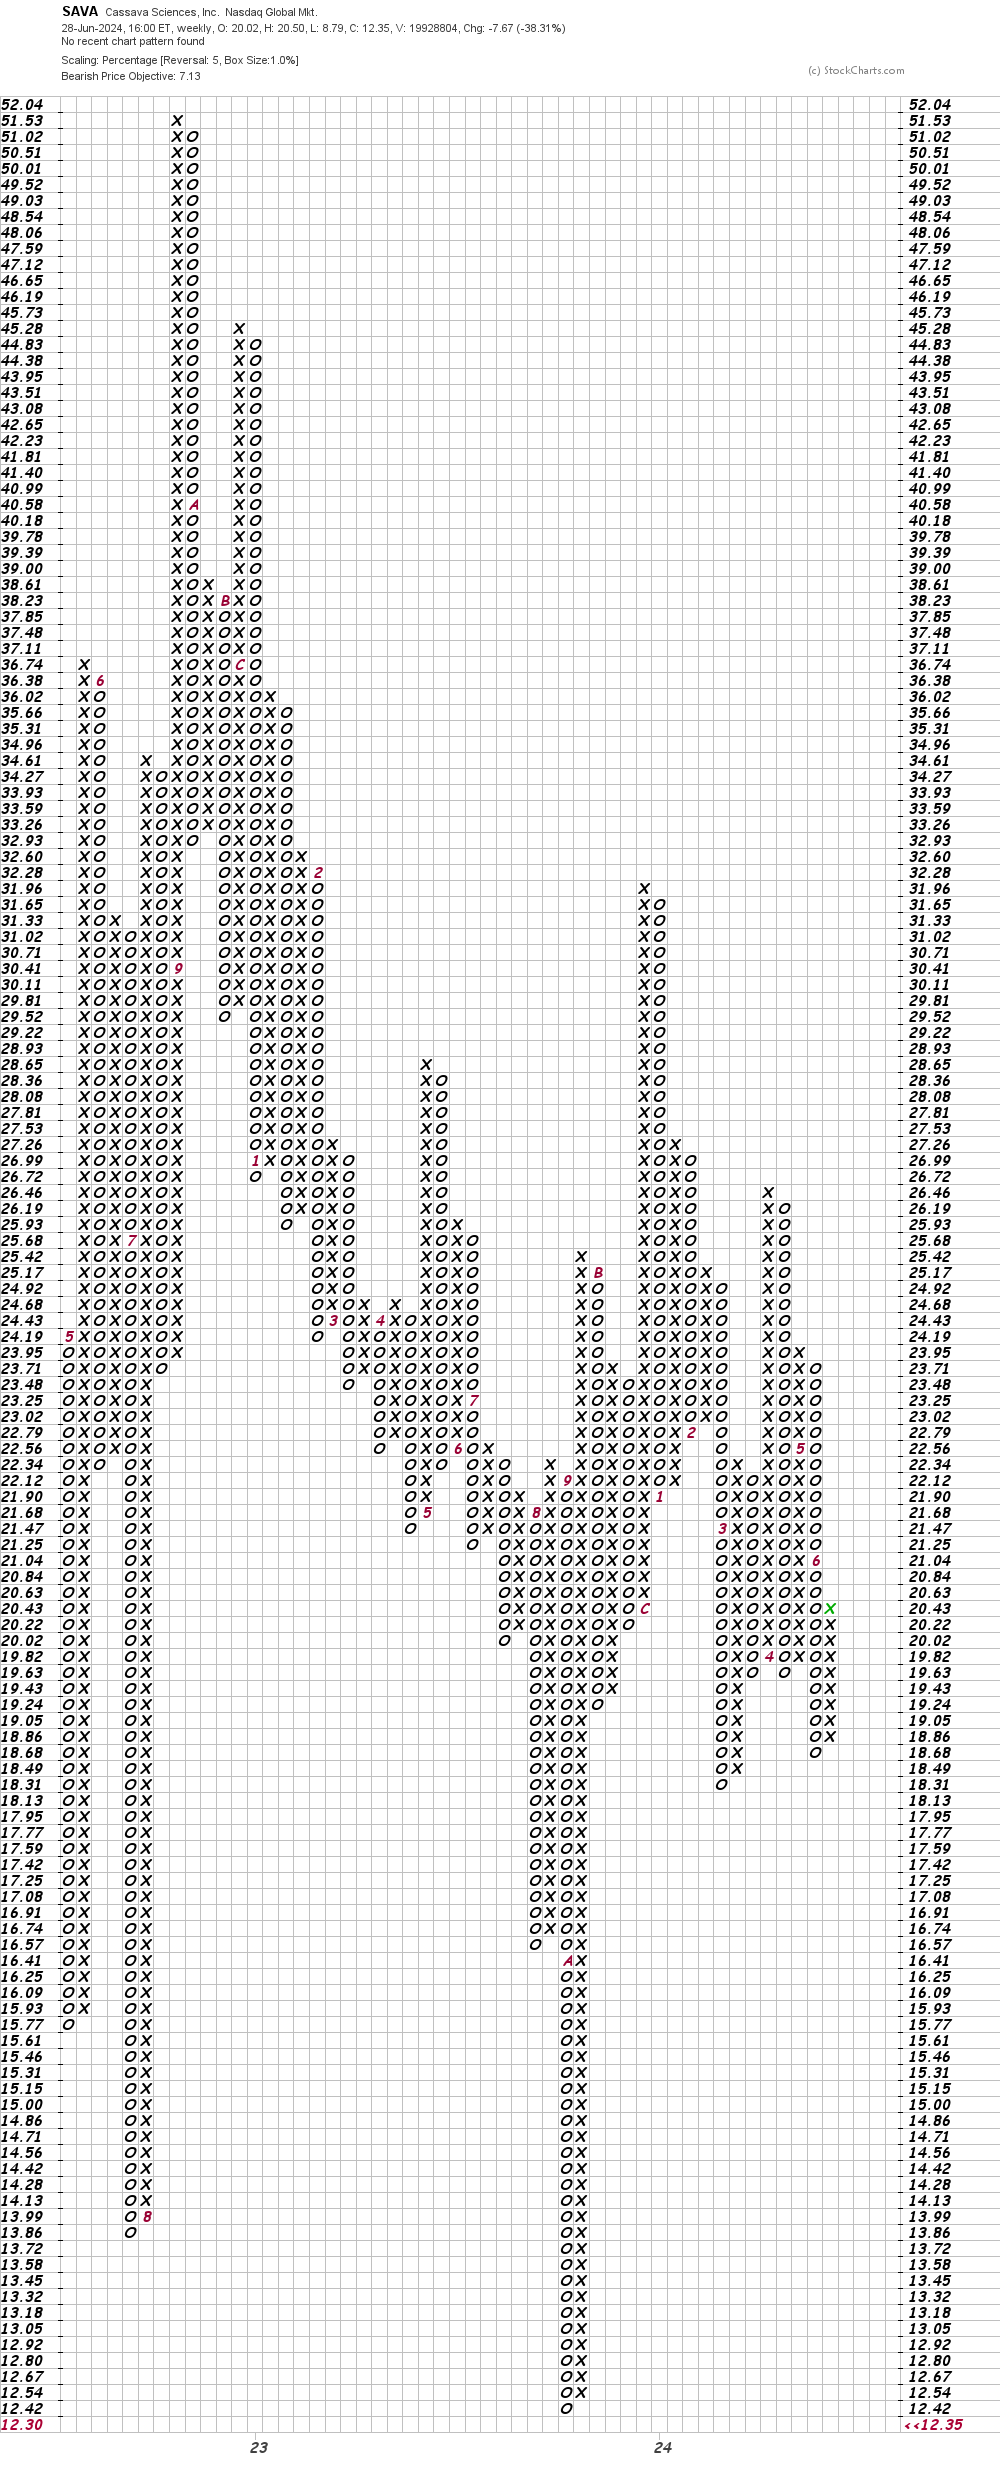
In this weekly Point and Figure chart of SAVA, below, I also used a five box reversal filter. Here the software suggests a price target in the $7 area.
Bottom line strategy: SAVA was in a longer-term downtrend before Friday's bearish news. Traders should avoid the long side of SAVA.
Employees of TheStreet are prohibited from trading individual securities.