CarMax: Let's Check Under the Hood Ahead of Earnings
Here's what the charts and indicators reveal about the shares.
You've reached your free article limit
You've read 0 of 1 free Pro articles.
Used-car dealer CarMax KMX is scheduled to report its latest quarterly numbers on Friday before the market opens. Let's check out the charts and indicators to see if a rally or a selloff is coming.
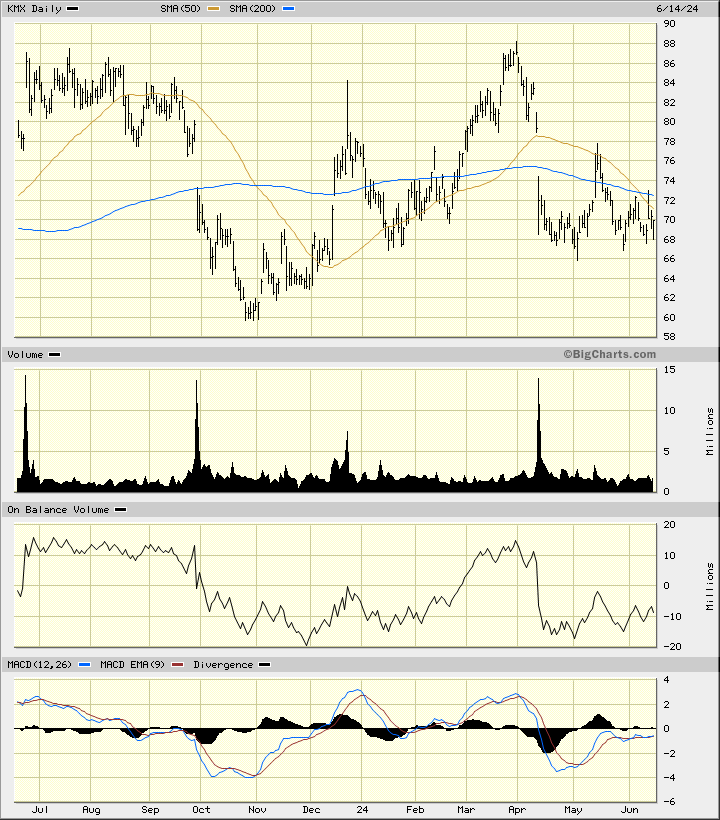
In this daily bar chart of KMX, below, the shares have moved sideways in a choppy range the past six months or so. Prices have been trading around the 50-day and 200-day moving average lines.
The On-Balance-Volume (OBV) line has bounced around since November. The Moving Average Convergence Divergence (MACD) oscillator has been moving sideways but below the zero line.
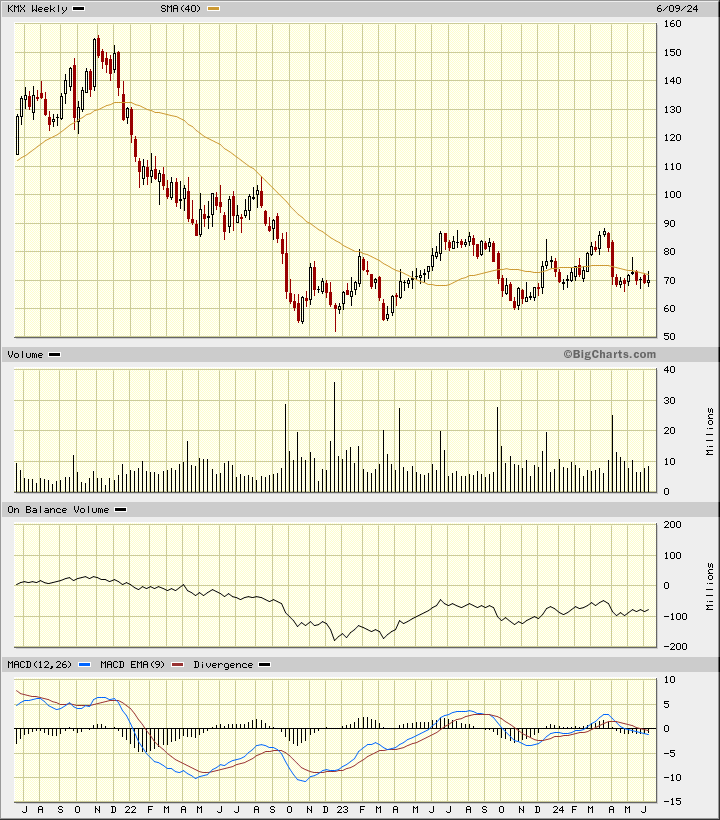
In the weekly Japanese candlestick chart of KMX, below, I see a mixed pattern the past two years. The shares are trading just below the 40-week moving average line.
The weekly OBV line shows us a positive trend since early 2023. The MACD oscillator is slightly below the zero line.
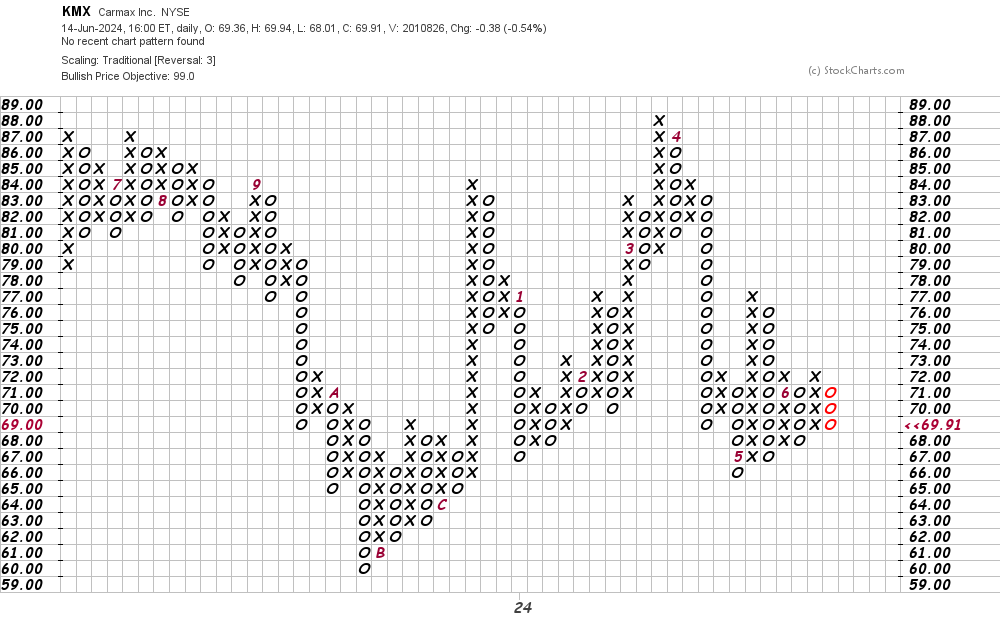
In this daily Point and Figure chart of KMX, below, I can see that the software is projecting a potential upside price target in the $99 area. A trade at $66 could turn this chart negative.
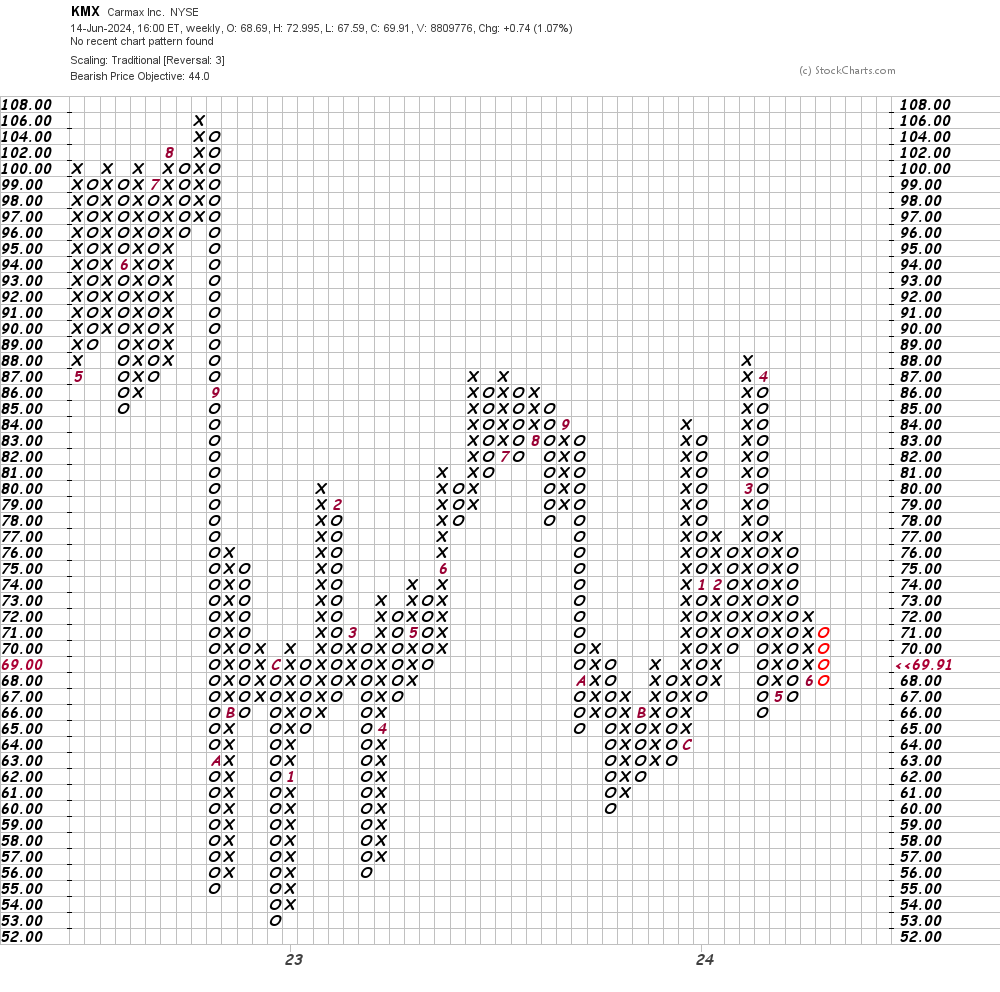
In this weekly Point and Figure chart of KMX, below, I can see a potential downside price target in the $44 area. Big difference from the daily chart above.
Bottom-line strategy: I have no special knowledge of what KMX will tell shareholders on Friday. The charts above are mixed so I have no firm opinion on which way things will go. The old saying on Wall Street is "when in doubt, stay out." Makes sense here for KMX.
Employees of TheStreet are prohibited from trading individual securities.