Can Ford Get It in Gear for an Upside Breakout?
Let's kick the tires for clues on this rally's destination.
You've reached your free article limit
You've read 0 of 1 free Pro articles.
The Ford Motor Company F has seen many ups and downs in its long corporate history. Ford's share price has rallied in recent weeks and could be gearing up for a key upside breakout.
Let's kick the tires so to speak of the charts and indicators.
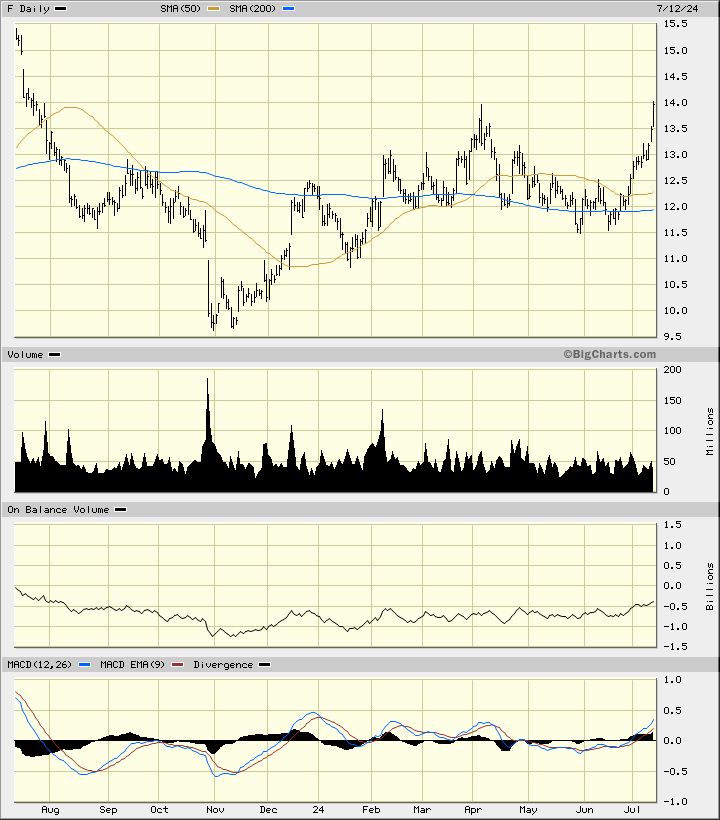
In the daily bar chart of F, below, I can see that the shares have rallied to test and maybe break the April highs. Prices are trading above the rising 50-day moving average line and above the bottoming 200-day line.
The trading volume looks like it has remained steady but the On-Balance-Volume (OBV) line is showing us some recent strength. The Moving Average Convergence Divergence (MACD) oscillator is in a bullish alignment above the zero line.
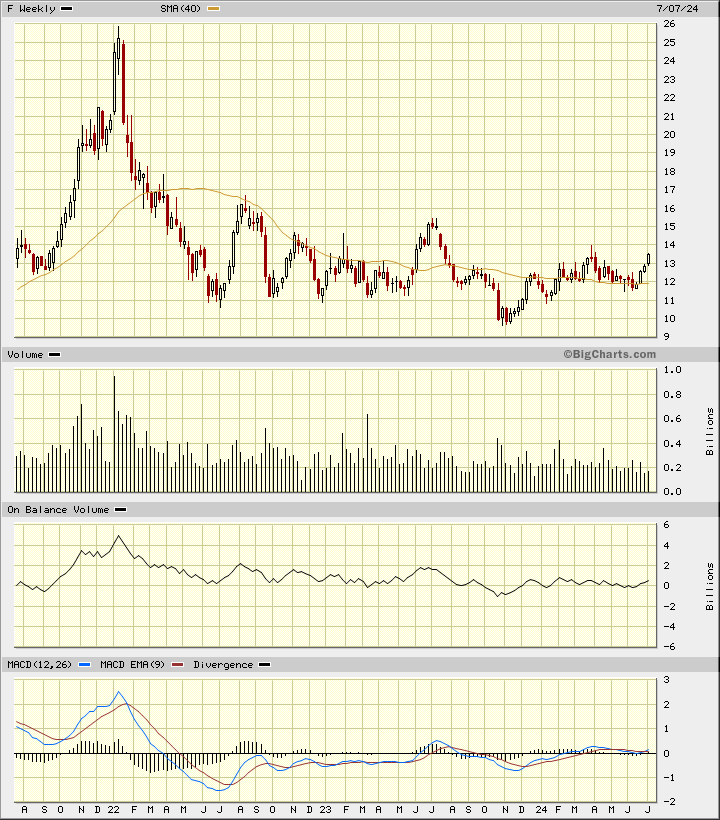
In the weekly Japanese candlestick chart of F, below, I can see that prices have been hammering out a base pattern the past two years. Prices trade above the bottoming 40-week moving average line.
The weekly OBV line is okay but I would like to see more strength out of this indicator. The MACD oscillator is slightly above the zero line. The real breakout point, in my book, is for F to close above its 2023 highs in the $15.50 area.
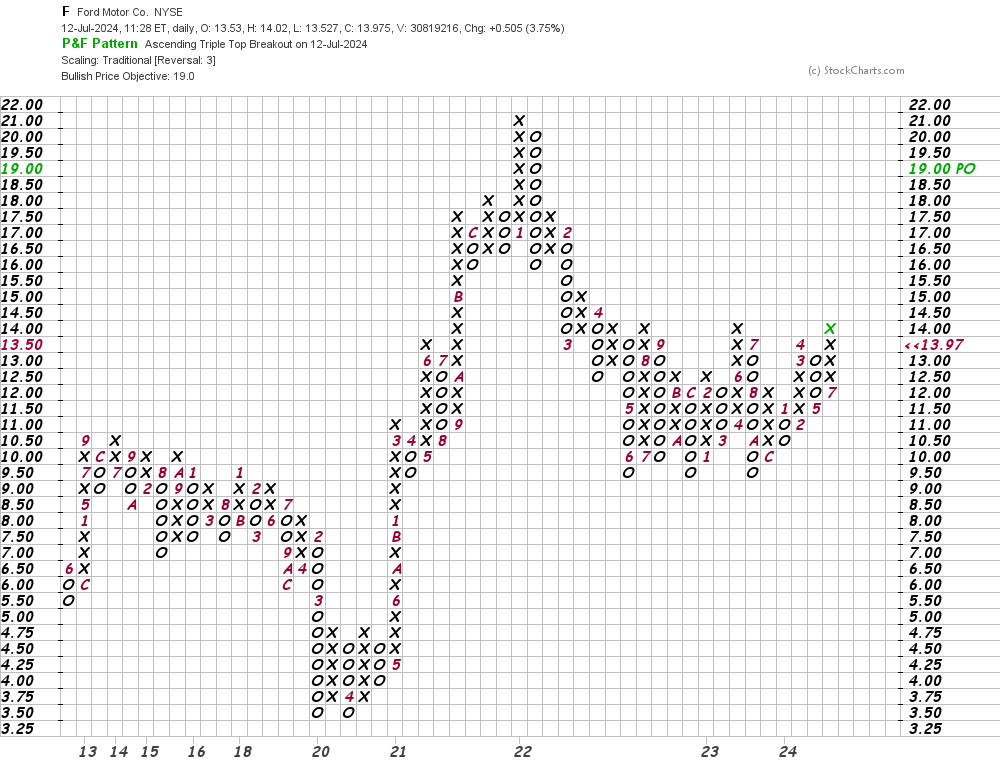
In this daily Point and Figure chart of F, below, I can see an upside price target in the $19 area.
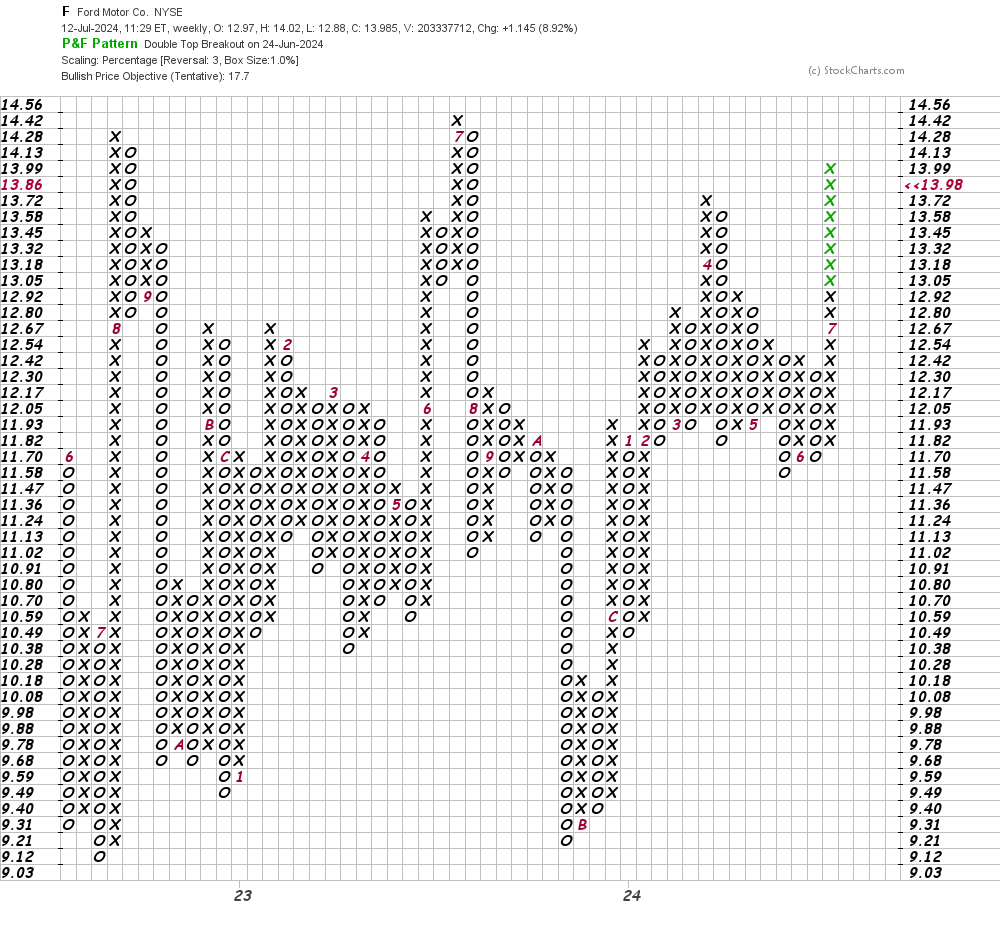
In this weekly Point and Figure chart of F, below, I can see an $18 price target.
Bottom-line strategy: The automotive industry is hard — CEOs have to deal with constantly shifting trends, government actions, tariffs, labor issues and more.
If F can keep climbing it might be time to buckle up before a breakout over the highs of 2023.
Employees of TheStreet are prohibited from trading individual securities.