After Financials Beat Wall Street, Here's How to Buy Applied Materials
The semiconductor firm has beastly cash flows and I'm ready to buy in.
You've reached your free article limit
You've read 0 of 1 free Pro articles.
On Thursday evening, almost in isolation, Applied Materials AMAT reported the firm's fiscal third quarter financial results. The equipment, services and software provider to the semiconductor industry counts the foundries such as Taiwan Semiconductor TSM and Intel INTC among its significant clients.
For the three-month period ended July 28, 2024, AMAT posted an adjusted EPS of $2.12 (GAAP EPS: $2.05) on revenue of $6.778 billion. These top- and bottom-line results both beat Wall Street's expectations, while the sales print was good for year-over-year growth of 5.4%. The adjustment of seven cents came from several rather minor impacts, most notably unrealized losses and gains in strategic investments.
Operations
As sales were growing 5.4% to $6.778 billion, the cost of those sales grew 3.6% to $3.573 billion. This left a gross profit of $3.205 billion (+7.7%) as gross margin improved from 46.3% to 47.3%. Operating expenses increased 7.6% to $1.263 billion, leaving GAAP operating income at $1.942 billion (+7.8%) as operating margin improved to 28.7% from 28%. After accounting for interest, taxes and other income/losses, net income printed at $1.705 (+9.3%), which worked out to $2.05 a fully diluted share, up from the year ago comp of $1.85.
Segment Performance
- Semiconductor Systems generated net sales of $4.924 billion (+5.3%), producing operating income of $1.712 billion (+9.2%), on an operating margin of 34.8% (up from 33.5%). Foundry drove 72% of sector sales, down from 79%, as Flash remained at 4%. DRAM increased its share of sales from 17% to 24%.
- Applied Global Services generated net sales of $1.58 billion (+7.9%), producing operating income of $467M (+17%), on an operating margin of 29.6% (up from 27.3%).
- Display and Adjacent Markets generated net sales of $251 million (+6.8%), producing operating income of $16 million (-50%), on an operating margin of 6.4% (down from 13.6%).
Guidance
For the current (fiscal fourth) quarter, Applied Materials expects to generate net sales of roughly $6.93 billion at the midpoint, with room for $400 million either way. This would be a penny better than Wall Street's consensus view. Adjusted EPS for the quarter is seen in between $2.00 and $2.36. The midpoint of that guidance would be a nickel better than the $2.13 that the street was looking for.
Fundamentals
For the quarter reported, Applied Materials generated operating cash flow of $2.385 billion, out of which came capex spending of $297 million. That left free cash flow of $2.088 billion. Out of this number, the firm repurchased $881 million shares of common stock and paid out $331 million in cash dividends to shareholders. Most of the rest was moved to the firm's cash position.
Turning to the balance sheet, AMAT, at the end of the period reported, had a cash position of $9.105 billion and inventories of $5.568 billion. This puts current assets at $20.671 billion. Current liabilities add up to $7.228 billion including almost (very little) short-term debt. That leaves the firm's current and quick ratios at a robust 2.86 and 2.09, respectively.
Total assets amount to $33.647 billion including $3.994 billion in goodwill and other intangibles. At less than 12% of total assets, this is of no concern. Total liabilities less equity comes to $14.807 billion. This includes long-term debt of $6.158 billion, which is something the firm could take care of out of cash if need be. This is a very strong balance sheet.
Wall Street
Since these earnings were released last night, 16 highly-rated (four-plus stars out of five by TipRanks) have opined on AMAT.
After allowing for changes, there are 12 "buy" or buy-equivalent ratings and four "hold" or hold-equivalent ratings. One of the "holds" chose not to set a target price, so we are working with 15 of those. The average target price across these 15 analysts is $249.60 with a high of $280 twice (Vivek Arya of Bank of America and Craig Ellis of B. Riley Financial) and a low of $210 (Blayne Curtis of Jefferies). Once omitting one of those highs and that low, the average target across the remaining 13 analysts improves to $250.31. For those with an interest, the average target among the "buys" is $257.08, while the average target among the "holds" is $219.67.
My Thoughts
I think this is a healthy report. I see the stock is trading lower supposedly because the guidance was not strong enough. To that, I say "baloney," as the firm guided above guidance on everything while still being conservative in a tough economic climate. Cash flows are beastly. The balance sheet is very well done. Applied Materials as a firm obviously has a talented CFO. I have always been partial to this space. Lam Research LRCX and KLA Corp KLAC have both been my stock picks for years past and I have done well in both, Lam in particular. I am not opposed at all to getting long some AMAT on a down day.
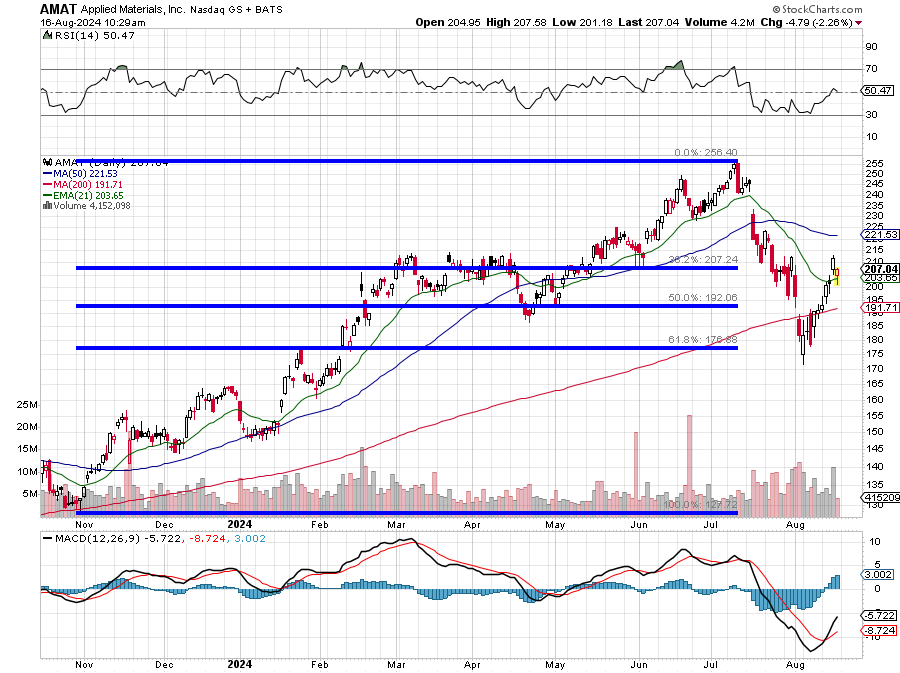
Readers will note that the recent bottom for this stock came at almost a precise 61.8% Fibonacci retracement of its October 2023 through July 2024 rally. Let's zoom in, shall we?
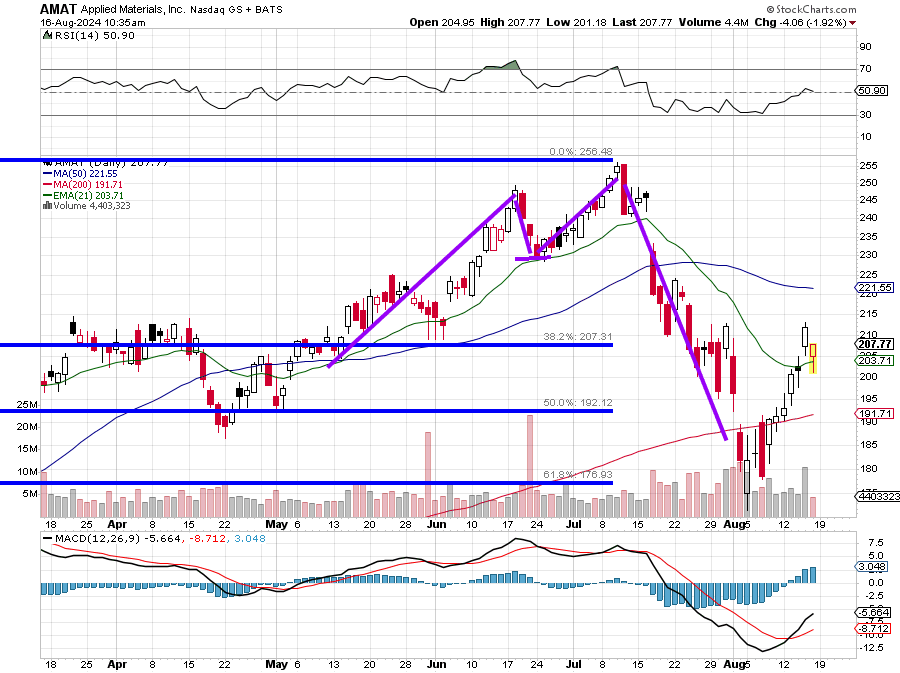
The stock got its double top induced sell-off and even dropped below not just its 50-day SMA, but more importantly, its 200-day SMA. It never exactly lost contact with that thin red line though. The stock's daily MACD displayed it's "buy" signal (12-day EMA over 26-day EMA, with nine-day EMA positive) and the stock took back its 200-day SMA and 21-day EMA.
Can you buy this one? I probably would have already bought some if I was not working on this piece. Hence, I will have to wait until my own article is public information. I think the stock can be bought at or close to that 21-day EMA, using the 50-day line as a pivot.
Applied Materials (AMAT)
- Target price: $267
- Pivot: 50-day SMA (currently $222)
- Add: 21-day EMA down to 200-day SMA
- Panic: On loss of 200-day SMA.
At the time of publication, Guilfoyle had no positions in any securities mentioned.
