Burger King Operator Should See Lower Prices Ahead
A close review of the data for Restaurant Brands International, which operates several popular quick-service brands, shows challenges.
You've reached your free article limit
You've read 0 of 1 free Pro articles.
Restaurant Brands International Inc. QSR is one of the world's largest quick service restaurant companies and it owns four of the world's most prominent and iconic quick service restaurant brands: Tim Hortons, Burger King, Popeyes and Firehouse Subs.
In full disclosure, I have only eaten in a Burger King and "fueled up" in a Tim Hortons.
Let's check out the charts and indicators to see if there is anything on the menu that appeals to investors.
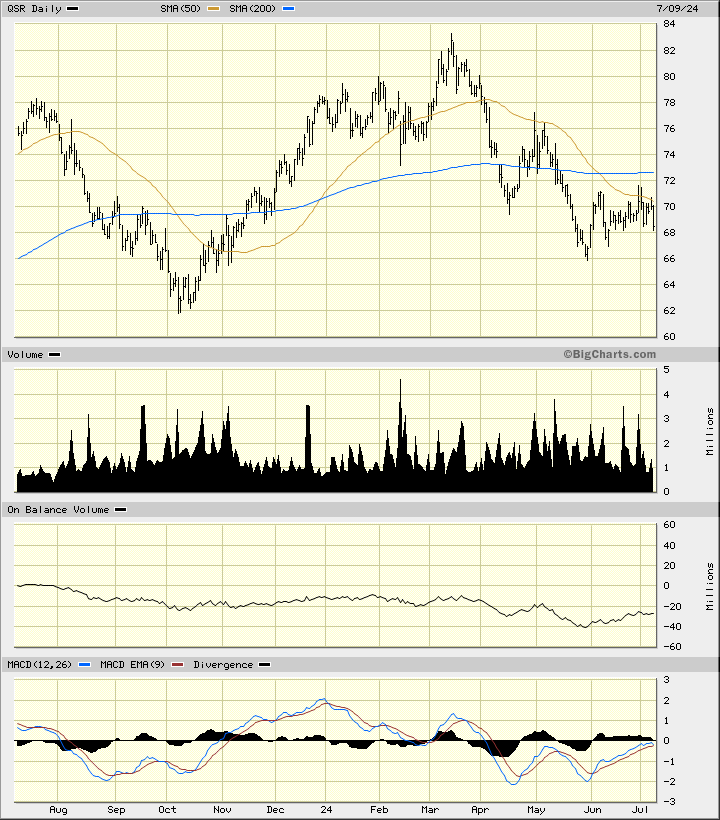
In this daily bar chart of QSR below, I can see that prices have made a peak in March. Prices have turned lower and now trade below the declining 50-day moving average line and below the declining 200-day line. The past five weeks look like a triangle continuation pattern that will result in the downtrend continuing. The trading volume looks more active in the past two months and it would seem that traders are voting with their feet. The On-Balance-Volume (OBV) line has lost some ground in the past year and suggests a shift from aggressive buying to aggressive selling. The Moving Average Convergence Divergence (MACD) oscillator has improved the last five weeks but is still below the zero line.
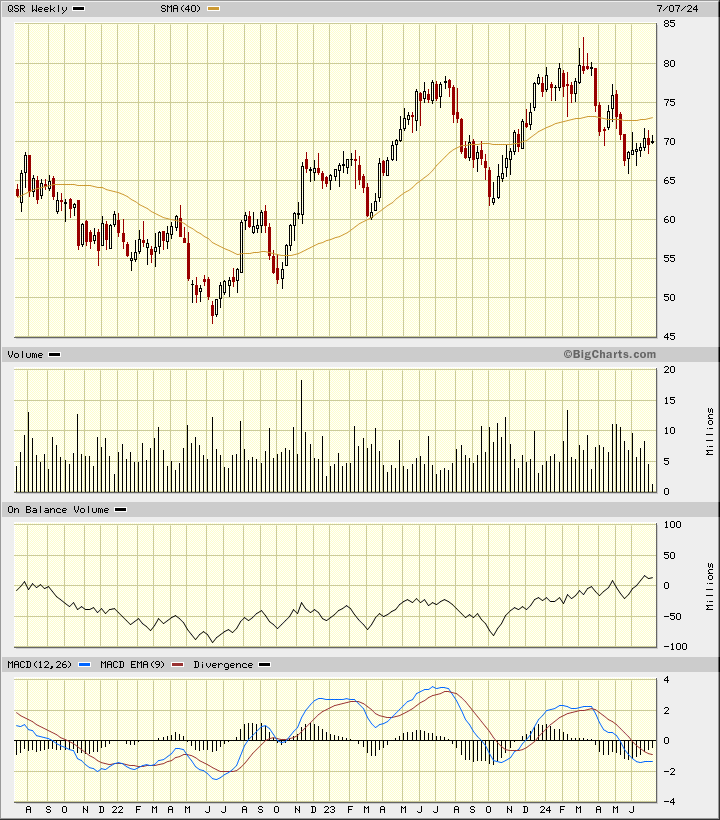
In this weekly Japanese candlestick chart of QSR below, I can see a pattern that is likely to lead to lower prices in the future. Prices have broken a longer-term uptrend (line not drawn). Prices trade below the 40-week moving average line. The candles in the past six weeks show a number of upper and lower shadows as prices search for a sustained direction. The weekly OBV line shows gains from October but also that it is struggling in the near term. The MACD oscillator is below the zero line but narrowing.
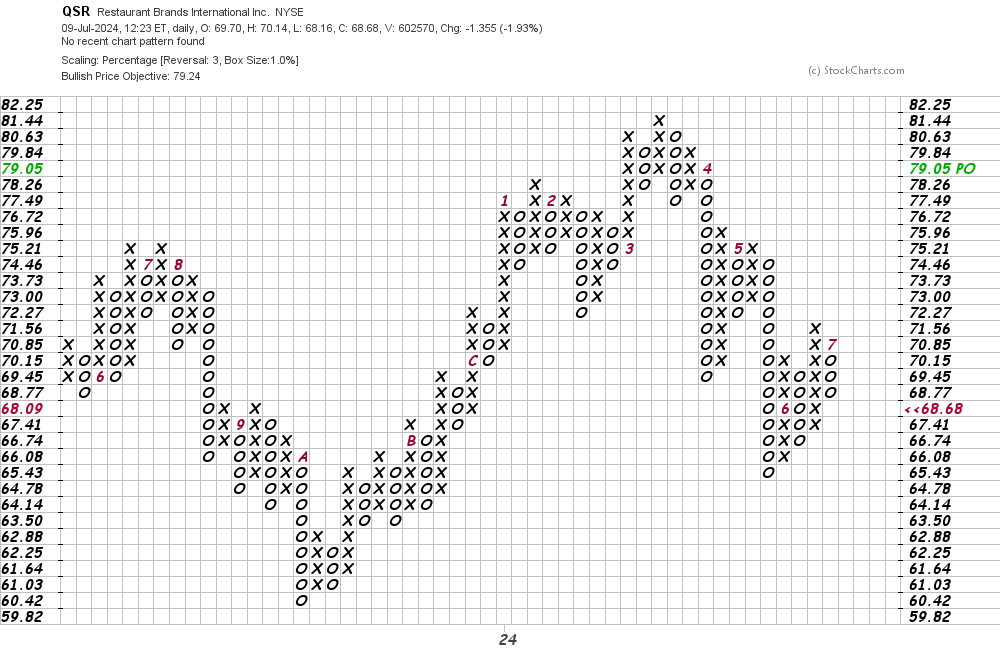
In this daily Point and Figure chart of QSR below, I can see a potential upside price target in the $79 area but a trade at $66.74 or lower could weaken this chart.
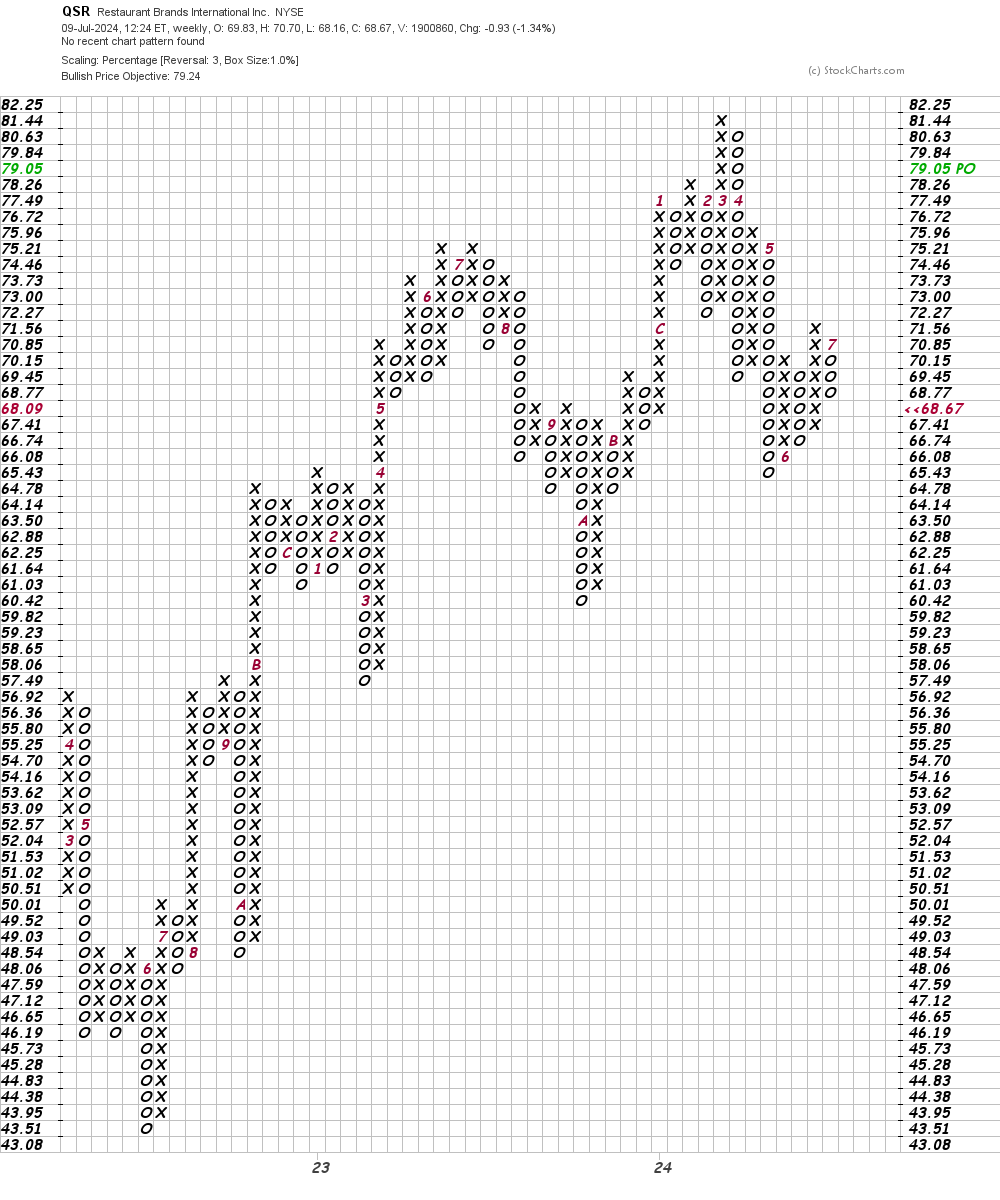
In this second Point and Figure chart of QSR below, I used weekly price data but the price target is the same as the daily chart above.
Bottom line strategy: The charts and indicators above suggest that the share price of QSR is likely to go lower in the weeks ahead. Traders and investors should defer purchases.
Employees of TheStreet are prohibited from trading individual securities.