Bristol Myers Squibb Could Be on the Mend
After a long time sinking in its sick bed, BMY might have finally hit bottom and be turning a corner. Here are my new price targets.
You've reached your free article limit
You've read 0 of 1 free Pro articles.
Pharmaceutical giant Bristol Myers Squibb BMY has suffered a long decline in its share price over the past few years. Is there some light at the end of the tunnel?
Let's check out some charts.
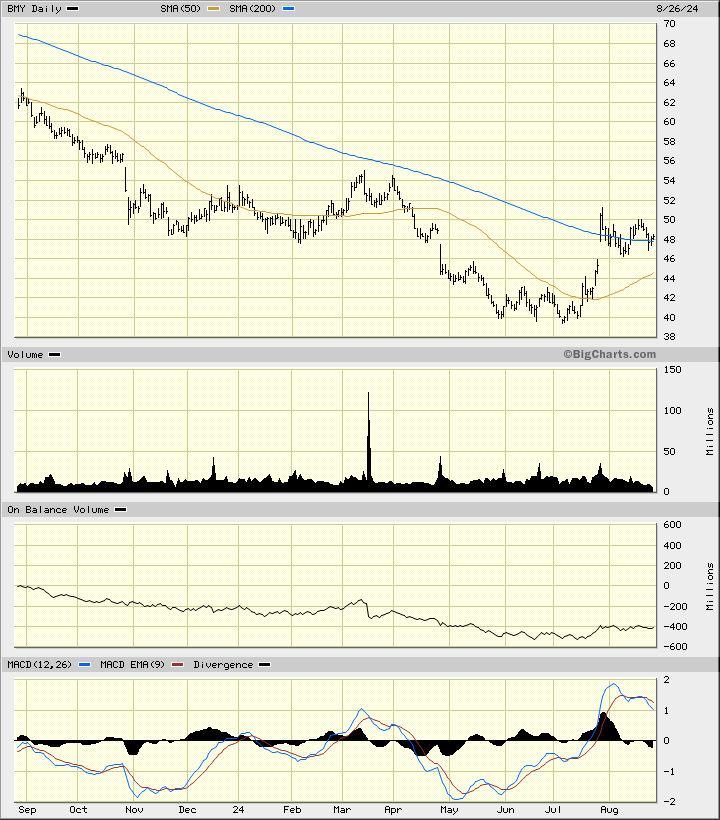
In this daily bar chart of BMY, below, I can see that prices have been finding buying interest (support) since late May. Prices rallied above the now rising 50-day moving average line in July and then made a gap to the upside showing us some strength we have not seen in a while.
The trading volume looks to be more active since May suggesting increased investor interest. The On-Balance-Volume (OBV) line shows improvement since June. The trend-following Moving Average Convergence Divergence (MACD) oscillator is above the zero-line, but it has been correcting.
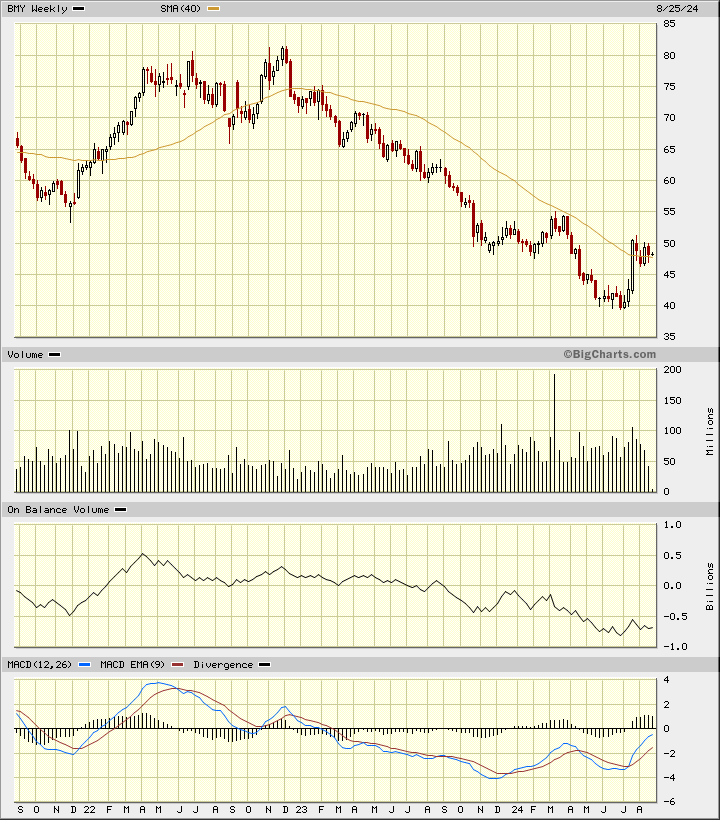
In this weekly Japanese candlestick chart of BMY, below, I can see that prices were cut in half over the past two years.
BMY has finally moved above the declining 40-week moving average line, but the slope of the line is still negative -- one step at a time. The trading volume has been increasing the past eight or nine months and that is a positive. The weekly OBV line declined into a low in June and shows me some "new life" in recent weeks. The trend-following Moving Average Convergence Divergence (MACD) oscillator crossed to the upside in early July for a cover-shorts buy signal.
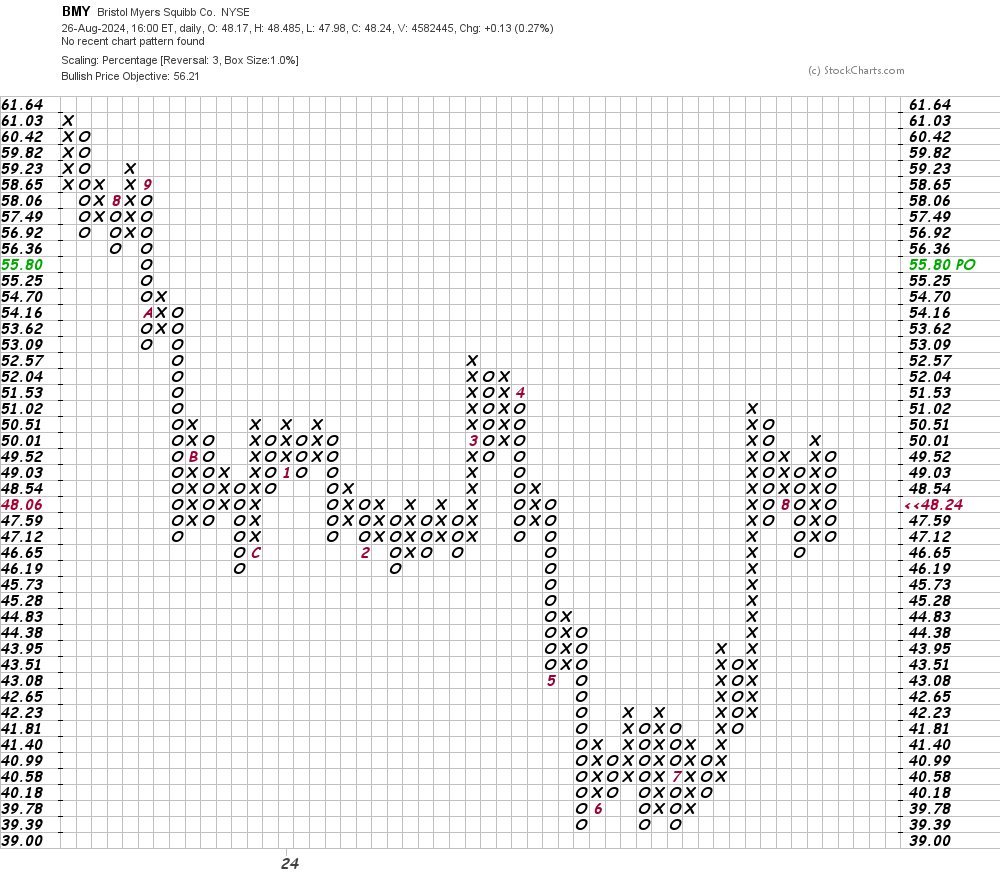
In this daily Point and Figure chart of BMY, below, I can see a base pattern and a potential upside price target in the $56 area.
In this weekly Point and Figure chart of BMY, below, I can see a price target in the $74 area. Not bad.
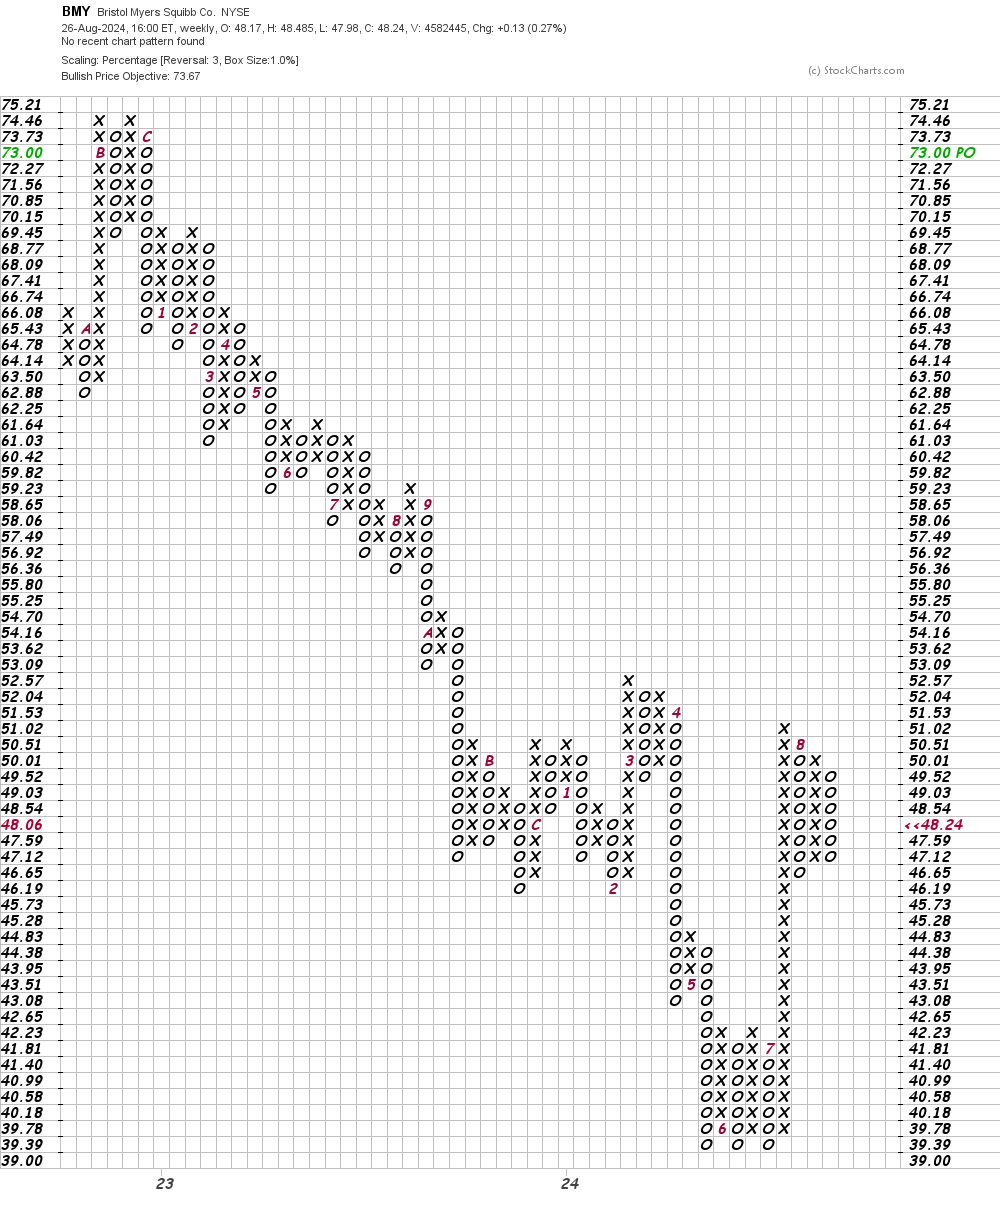
Bottom line strategy: Bottoms are a process for sure. BMY looks like it is bottoming after a significant decline. Investors and traders with patience could go long BMY around $47 risking to $43 or below the 50-day moving average line; $56 and then $74 are my price targets for the months ahead.
Employees of TheStreet are prohibited from trading individual securities.