Breadth Is So Bad That Non-Technicians Are Talking About It
Breadth has become incredibly narrow, to the point of being oversold. So what's next?
You've reached your free article limit
You've read 0 of 1 free Pro articles.
The Market
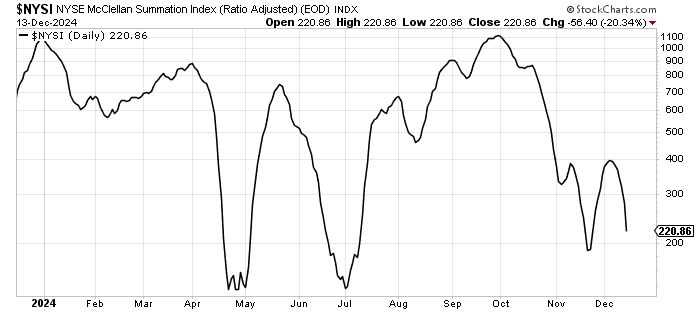
The breadth of the market has been so poor that even the non-technicians are talking about it. Heck, I haven’t heard anyone talk about the broadening out lately. We can see the lack of broadening in the McClellan Summation Index, which, with the exception of a rally in the middle of November, has been heading south for more than two months now.
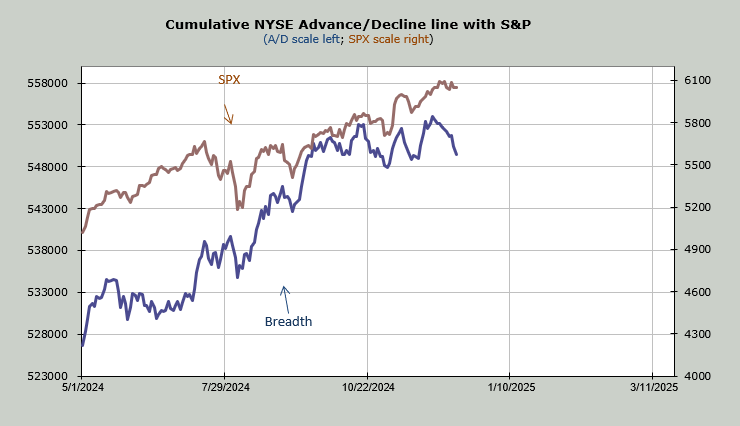
We can see it in the chart of breadth on its own. The blue line has been heading down for weeks now—and if you step back you can see has really made no progress in October—while the S&P notches upward.
But my Overbought/Oversold Oscillator is based on breadth. It is the ten-day moving average of the net of breadth. When we have long strings of negative breadth, we get short-term oversold. And that is where we are.
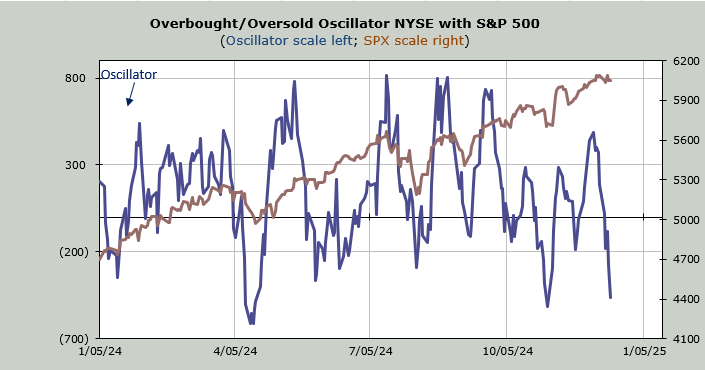
I always prefer an oversold condition that arrives with a whoosh. Or one that arrives with a steep rise in bearish sentiment. Thus far we have neither. Perhaps something will show up this week that gives us that to make the oversold condition feel better. Also keep in mind the traditional Santa Rally is not supposed to start until just before Christmas.
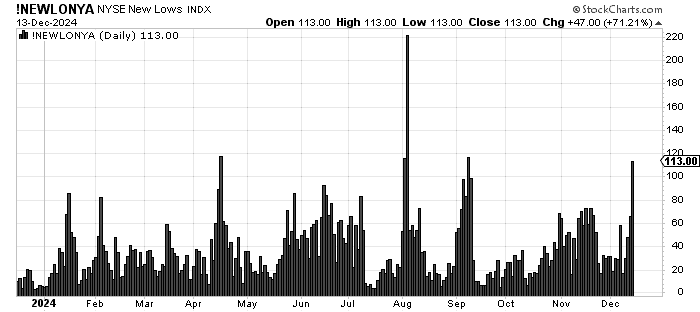
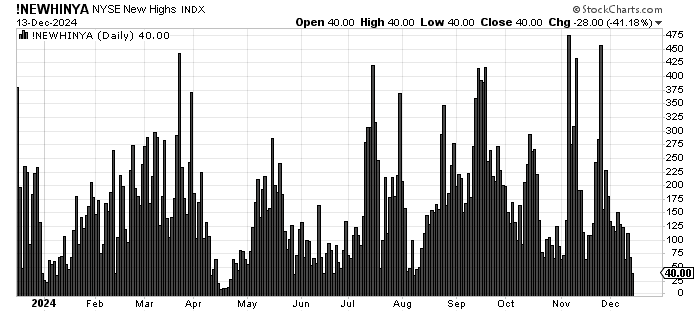
None of this erases the too-bullish sentiment. None of this erases the fact that the intermediate-term indicators are overbought. None of this erases the fact that the number of stocks making new highs is fewer than the number making new lows, nor does it mitigate the fact that Friday saw the most new lows since September when the S&P was more than ten percent lower. But that’s why I think after an oversold rally we should have a more substantial correction.
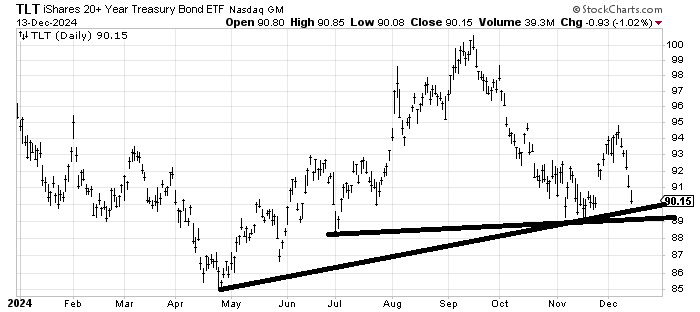
Since we are heading into the FOMC meeting this week, we should talk about bonds. Sure, I thought we’d see a pullback from 94-95 in TLT, but I did not think we’d see a total collapse, yet that is what we have.
TLT is coming into good support in the 89-90 area and is really getting oversold. The DSI on bonds is back to 13 so if TLT falls much more the DSI ought to slide closer to single digits which would mean it’s back to rally mode.
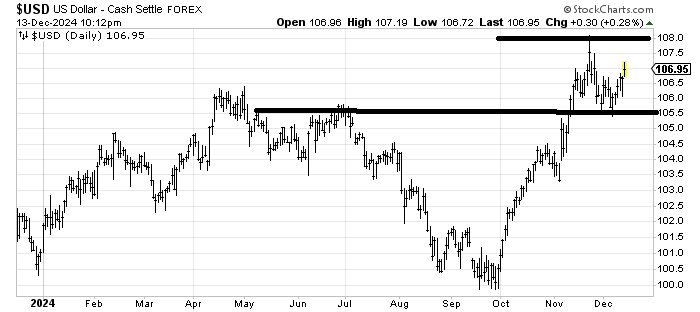
To couple the TLT with the move in the buck, let me remind you that I expect that spike high at 108 to be a problem for the US Dollar. The DSI on the buck is 85 so any challenge of that spike high ought to take the DSI to nosebleed territory.
If the buck can back off and the bonds can rally then I think that couples with the ‘others’ and their oversold condition for a Christmas rally.
New Ideas
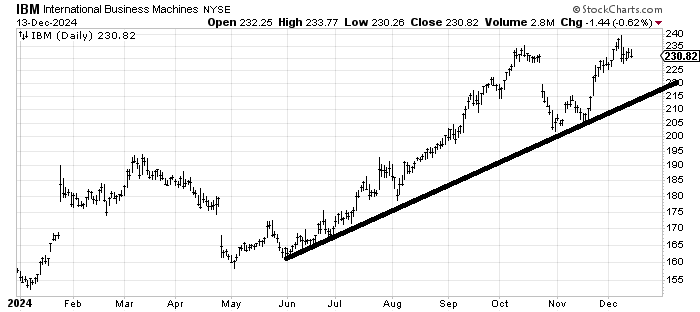
I want to follow up on IBM IBM which I was asked about a few weeks ago. I was positive on the chart but I thought a pullback would lead to another rally. I am still leaning that way but if the stock breaks 227-ish it will look more like that rally to 240 was a last gasp attempt at a new high and a more substantial correction to that line would be in order.
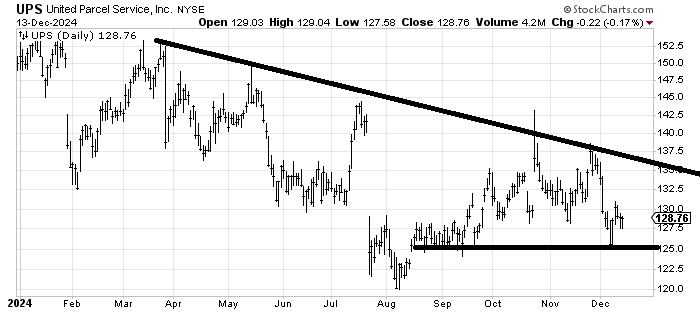
The Transports are so oversold that I am searching for a down and out name in the group that has a decent risk/reward. If United Parcel Service UPS can hold this 127-ish area then maybe it has a rally to resistance around 133.
Today’s Indicator
The new highs and new lows are discussed above. Here is the chart of new highs.
Q&A/Reader’s Feedback
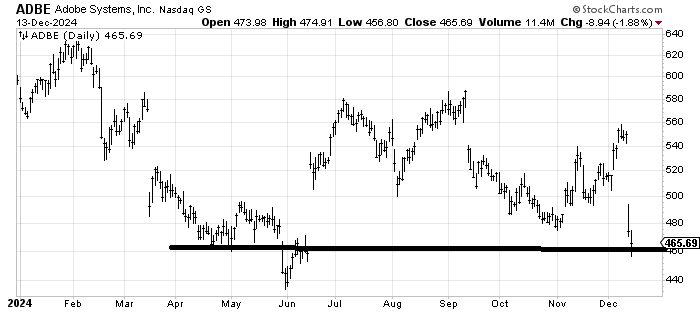
Adobe ADBE is such a disappointment. It filled the gap (560) and then collapsed, having gone into earnings with a nice set up. It has filled the gap from June so it ought to get a bounce but I wouldn’t expect much heading into the new year because it could be subject to tax loss selling.
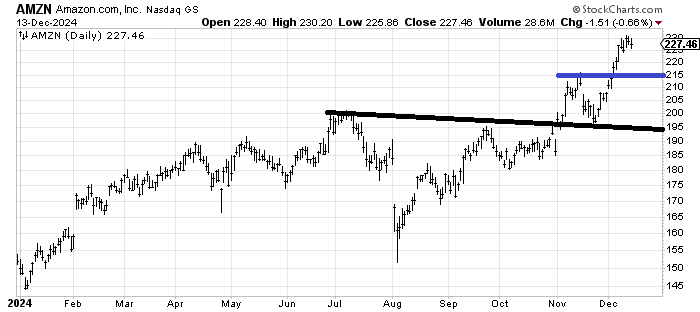
We have had a nice trade in Amazon AMZN but it has now stalled. There is a measured target of 230-240 off that breakout in early November. It wouldn’t surprise me if it rallied or fell from here but I just don’t see the set up to buy more here. Maybe it will feel better at 215 (blue line) but up here I’m inclined to take a little off the table.
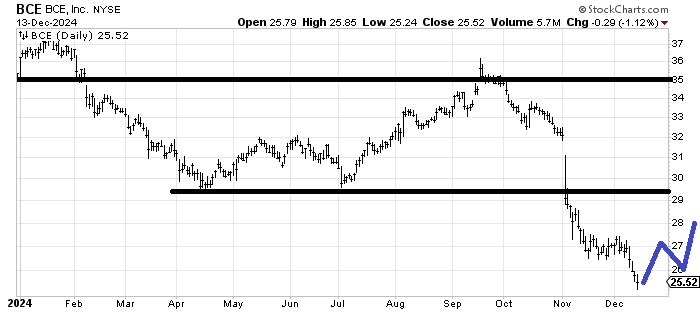
BCE BCE is a stock in a downtrend and I don’t see that ending. However, there is a measured target in the 23-25 area so I would expect it to get oversold in the coming days and enjoy some sort of rally. If it can start mapping out something akin to what I have drawn in blue in 2025 then I would see some promise but now I only see an oversold rally.
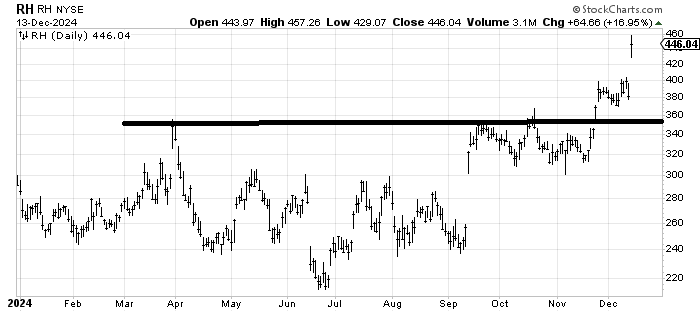
RH RH has a measured target in the 480-90 area. My only caution would be that the stock has a tendency to gap up and die (see March, see September) so if it shows signs of waning I would not hang around for the measured target.
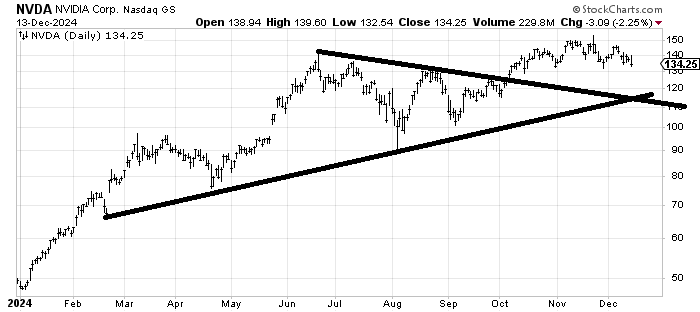
Does everyone see the head and shoulders top in NVIDIA NVDA? A break of 130 would solidify it. And quite frankly the measured target would be around the intersection of those lines (110-ish) so if it breaks, that’s where I think it go. Mostly I have been neutral on it for a while because the stock hasn’t done a thing in six months.
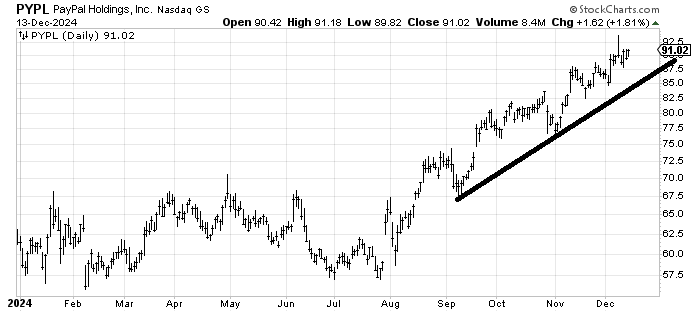
PayPal PYPL has been a good stock since it broke out in August. The 90/100 rule applies now (90% of the stocks that make it to 90 will make it to 100). If the stock breaks that uptrend line though, it will go into the ten percent category so that’s your stop (which feels far away to me)