Biopharma's New Price Target Suggests the Stock Could Rise 40%
Let's check in on my trade strategy for this small-cap name.
You've reached your free article limit
You've read 0 of 1 free Pro articles.
On June 7 when I reviewed the charts and indicators of Catalyst Pharmaceuticals CPRX I recommended that "Aggressive traders who have done their research could go long CPRX on strength above $17.50." Let's check in and see how that trade is going.
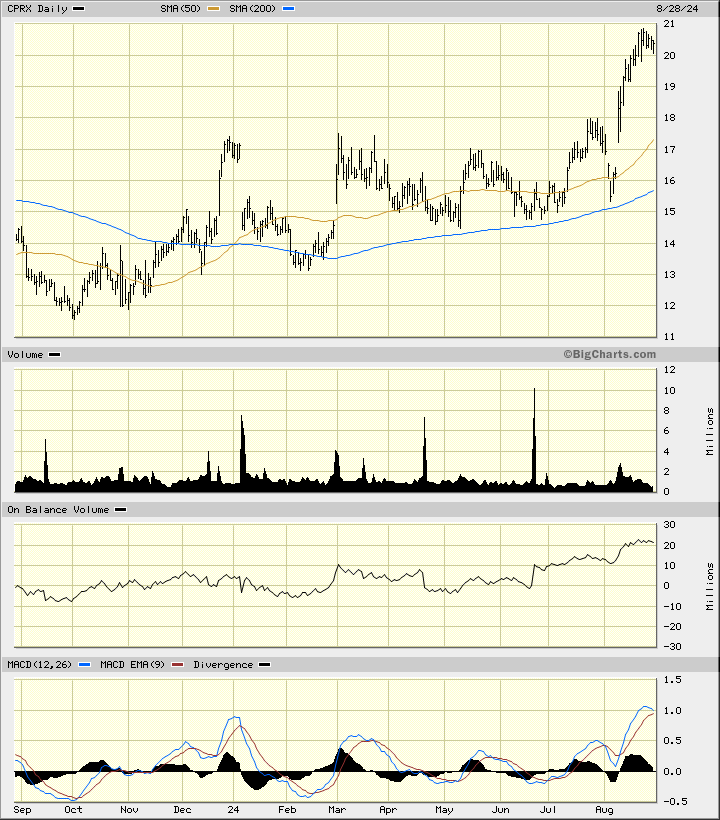
In the daily bar chart of CPRX, below, I can see that the shares rallied above $17.50 in late July before pulling back and then shooting sharply higher this month. CPRX trades above the rising 50-day moving average line and above the rising 200-day moving average line.
The daily trading volume has been more active this month suggesting increased investor interest. The On-Balance-Volume (OBV) line shows strength since early May. The Moving Average Convergence Divergence (MACD) oscillator is above the zero line but has narrowed recently suggesting that the strength of the uptrend is fading.
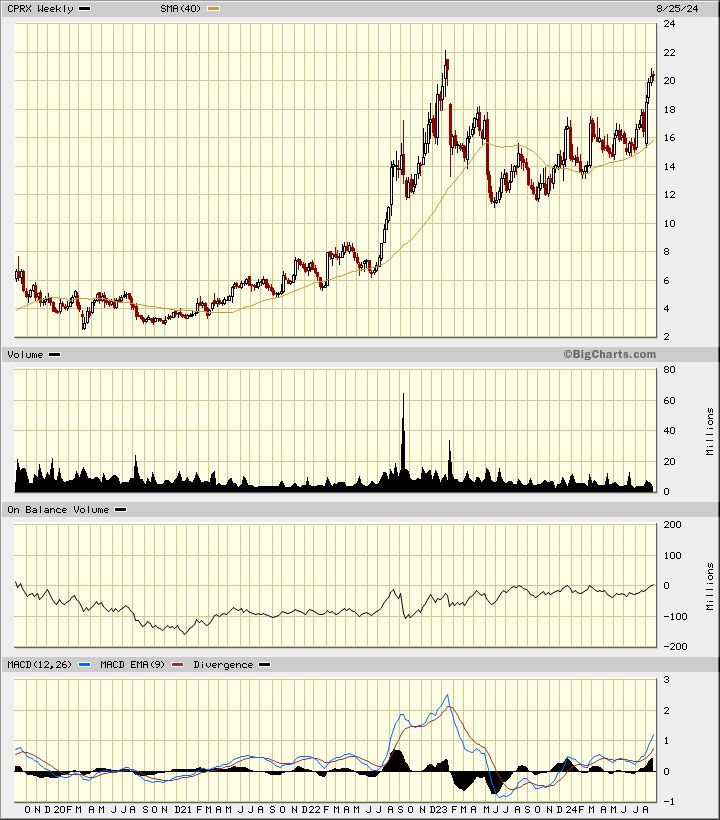
In the weekly Japanese candlestick chart of CPRX, below, I looked back five years to put the latest action into perspective. the shares look poised to make an upside breakout to all-time new highs. CPRX trades above the rising 40-week moving average line.
The weekly OBV line is firm and rising and close to its own new high. The MACD oscillator is in a bullish alignment above the zero line.
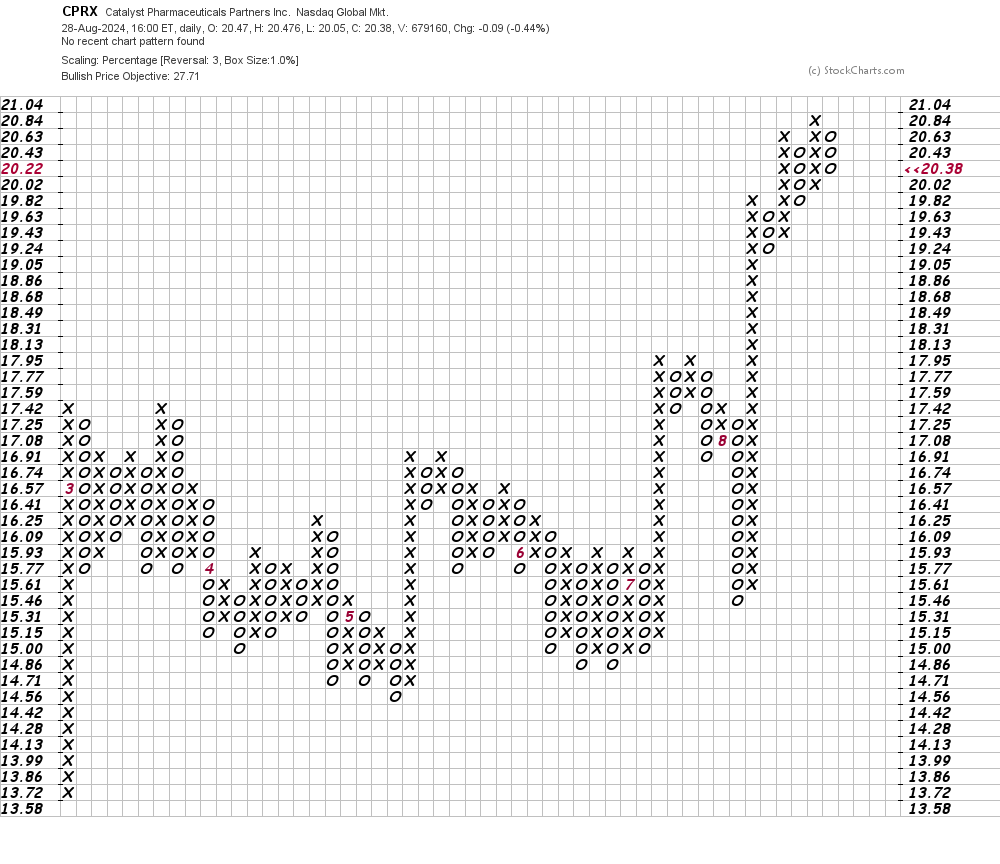
In this daily Point and Figure chart of CPRX, below, I can see an upside price target in the $28 area.
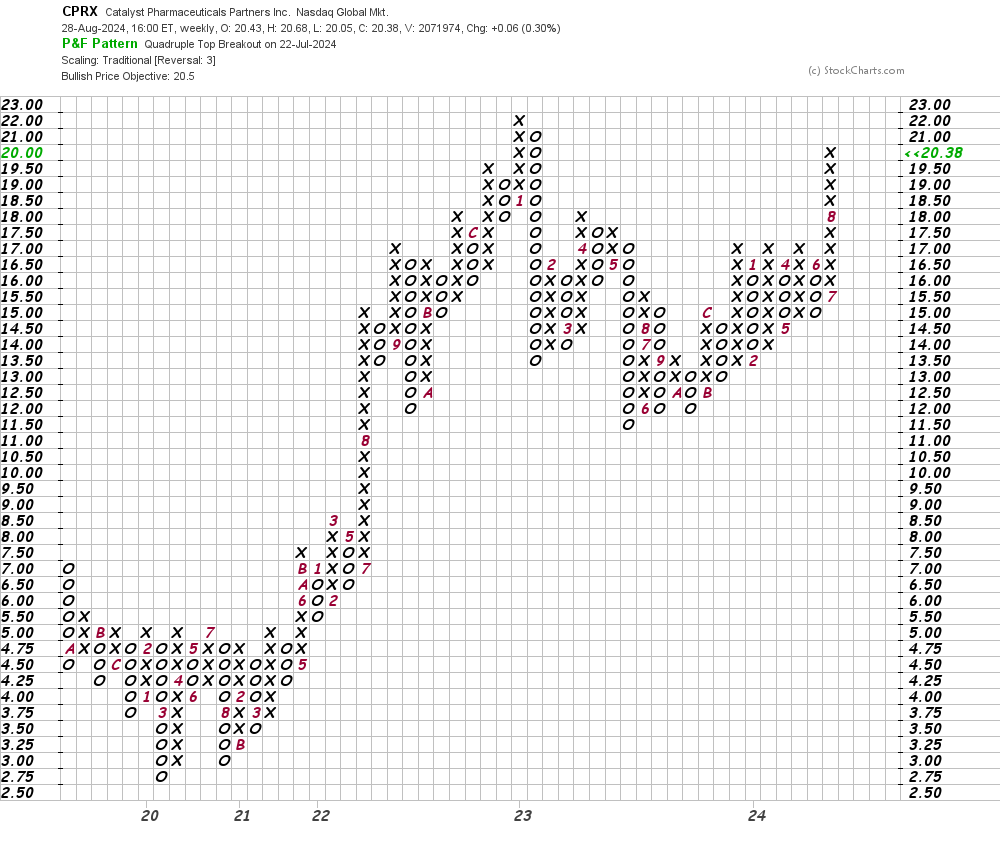
In this weekly Point and Figure chart of CPRX, below, I can see an upside price target of $20.50 but a trade at $23 should refresh the uptrend.
Bottom-line strategy: Traders who went long CPRX on strength above $17.50 should continue to hold. Risk to $18. The $28 area is my nearest price target for now.
Employees of TheStreet are prohibited from trading individual securities.