Bearish Bets: 3 Vulnerable Stocks You Should Consider Shorting This Week
Here's why these names could fall further.
You've reached your free article limit
You've read 0 of 1 free Pro articles.
Let's check three stocks that appear technically bearish and look ready to short.
While we will not weigh in with fundamental analysis on these issues, we will pop the hood for a look at the charts.
Let's dig in.
Signet Is Not Sparkling or Twinkling
Earnings were out this past week on Signet Jewelers SIG and they were not beautiful. But we did see a potential breakdown taking place just days ago with some pretty heavy turnover to the downside. That was a "tell," or an indication of more selling to come. The chart, though, while not horrible up to that point, totally imploded on Thursday.
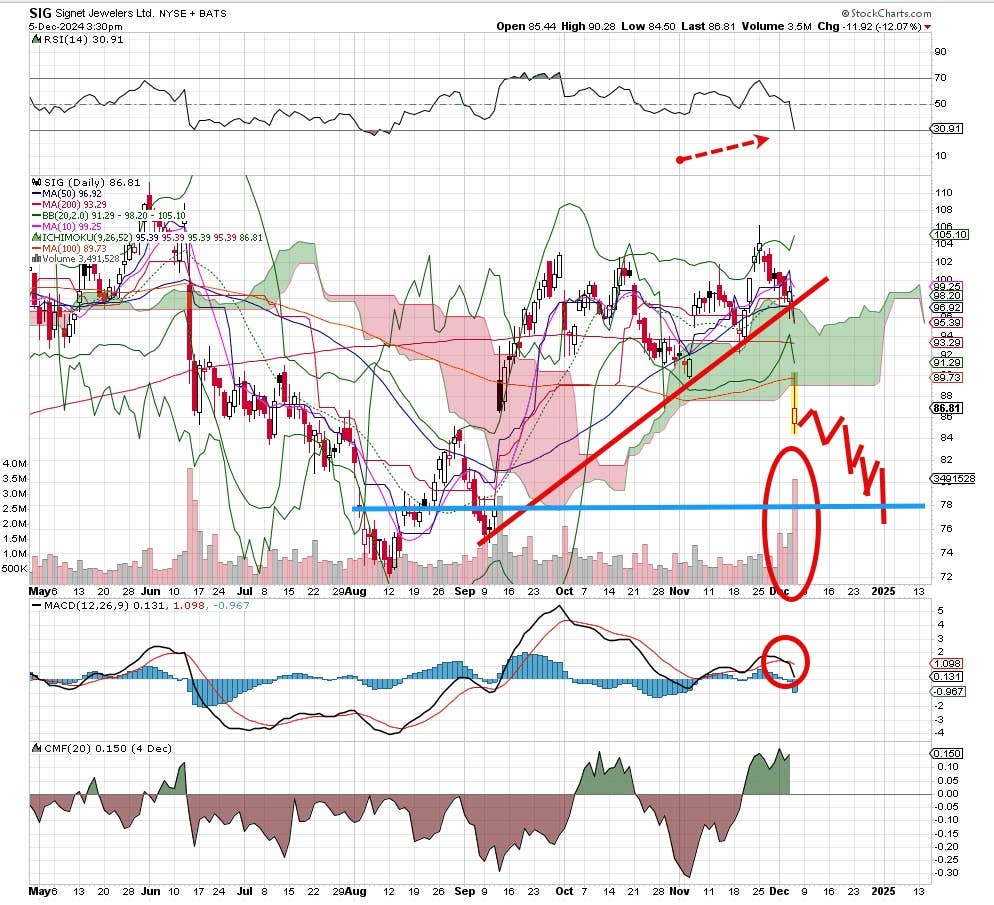
The MACD (moving average convergence/divergence) has started to roll over, and the RSI (relative strength index) is oversold, but this is really day six, and there seems to be more downside here. In fact, there is an upside gap that needs to fill way down in the high $70's, and that is where we will set a target.
Let's be patient for the $76 level and then consider more downside to the high $60's. Place a stop at $96 just in case.
SentinelOne Badly Breaks a Medium-Term Trendline
SentinelOne S was looking good until getting busted this past week following weak earnings. The stock had looked quite sharp with a series of higher highs and higher lows (textbook uptrend). But look at those volume bars, very strong on these past few down sessions. That spells trouble for this stock, which is not even oversold by the standard of RSI (top pane) or money flow (bottom pane).
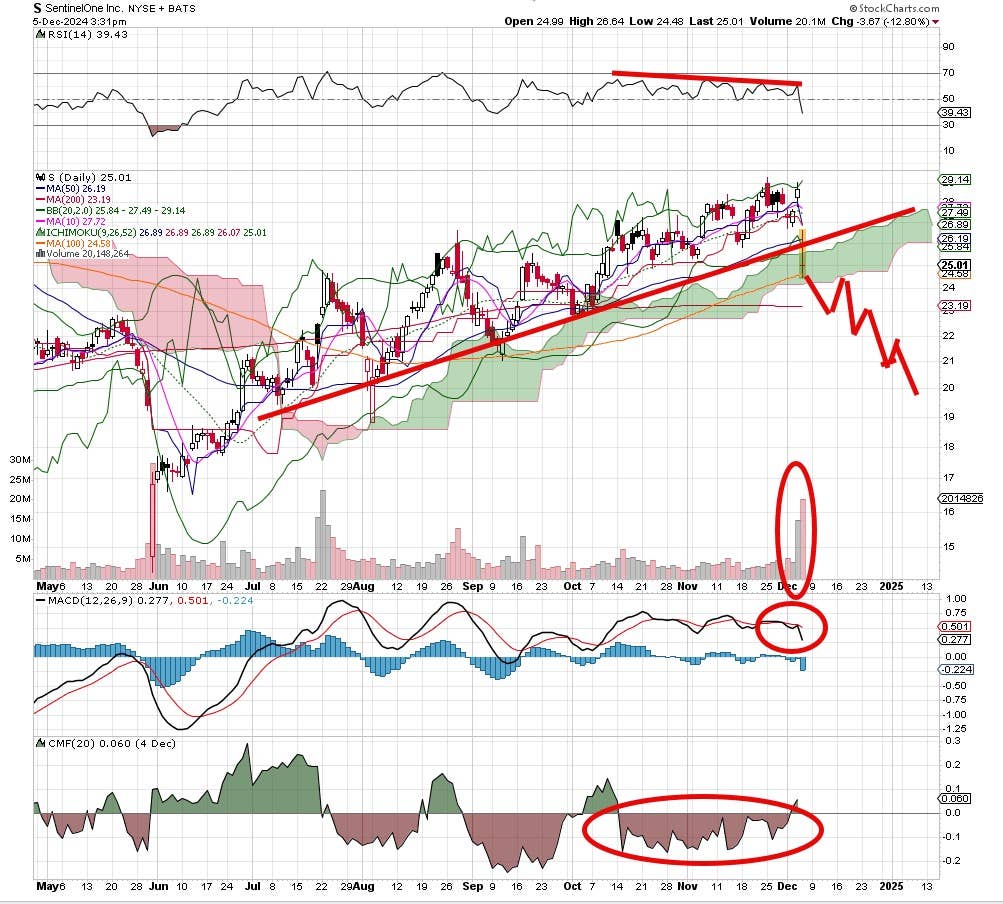
The MACD just rolled over to a sell signal. After the sharp rise since June, SentinelOne has little support until the $17 area, which seems a nice profit target on a short play. Put in a stop at $27 just in case. This is a very bearish looking chart and with some follow-through to the downside, it makes this short idea seem so very right.
Caleres Broke Support Long Ago
Caleres CAL stock has been bad for weeks, with a series of lower highs and lower lows in place since peaking back in July. Notice the head/shoulders pattern, which is one of the most bearish in the technical analysis universe. There's no telling where this stock is going to stop falling, but it is circling the drain fast.
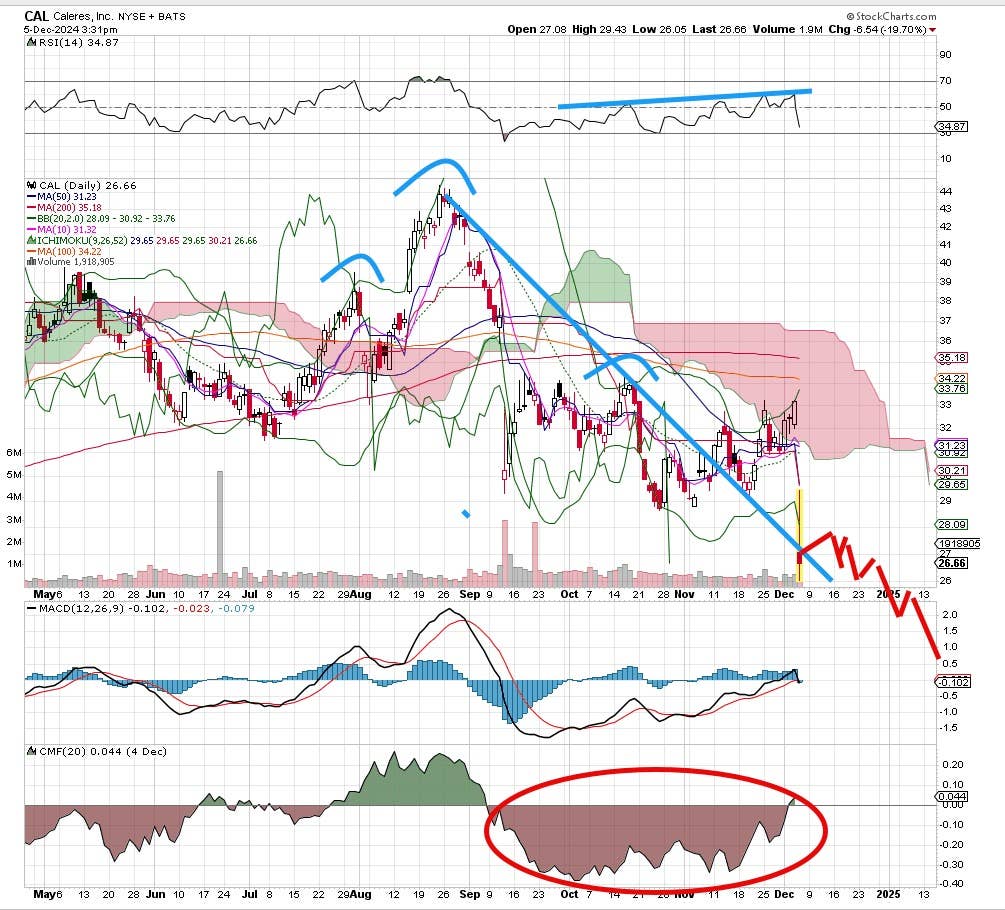
The indicators are bearish, with a rollover on the MACD and weakness in money flow and the RSI. The cloud has been red for weeks and remains so. Volume trends are also bearish. There's nothing positive about this chart so we think downside has some profit potential.
Let's target $17 on this one, an aggressive move, but there is some support there. Put in a stop at $31.
