Avoid Buying This Semiconductor Name as Price Sputters
A global semiconductor company's stock price has been weakening over the last year and further declines look likely.
You've reached your free article limit
You've read 0 of 1 free Pro articles.
Global semiconductor company STMicroelectronics N.V. STM has been weakening on the charts over the past 12 months, but chart support has appeared in the $38 area since late October.
The indicators currently suggest another test and possible break of that support.
Let's take a closer look.
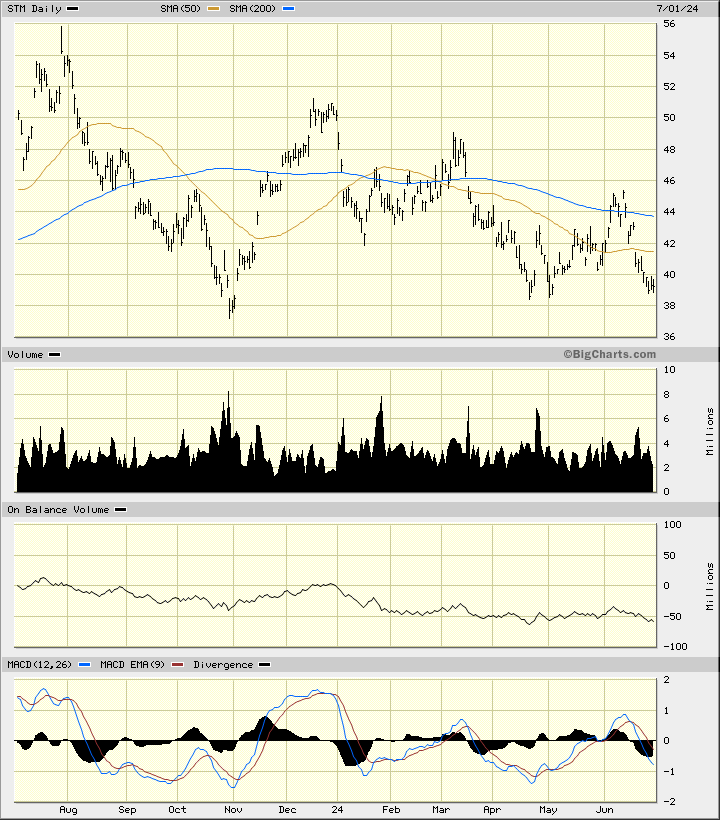
In this daily bar chart of STM below, I can see a pattern of lower highs going back the past 12 months. Prices trade below the declining 50-day moving average line and below the declining 200-day moving average line. The On-Balance-Volume (OBV) line has weakened the past year and tells me that sellers of STM have been more aggressive than buyers with more trading volume occurring on days when STM has closed lower. The trend-following Moving Average Convergence Divergence (MACD) oscillator is below the zero line now which tells us that the trend-strength is weak and rallies are likely to fail.
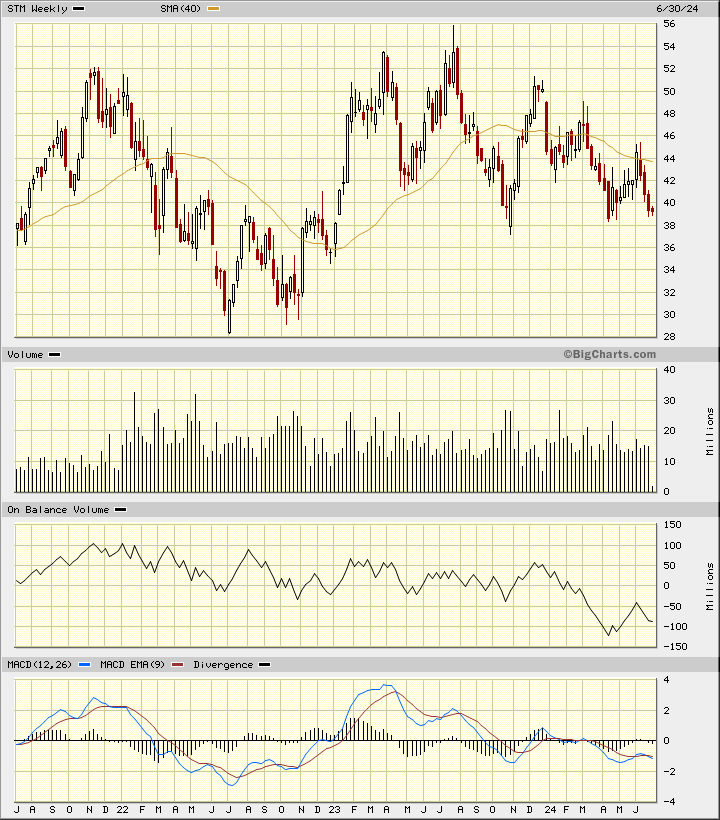
In this weekly Japanese candlestick chart of STM below, I see a bearish setup. Prices are trading below the declining 40-week moving average line. The weekly OBV line has moved lower the past three years and recently made a new low for the move down. The MACD oscillator is in a bearish alignment below the zero line.
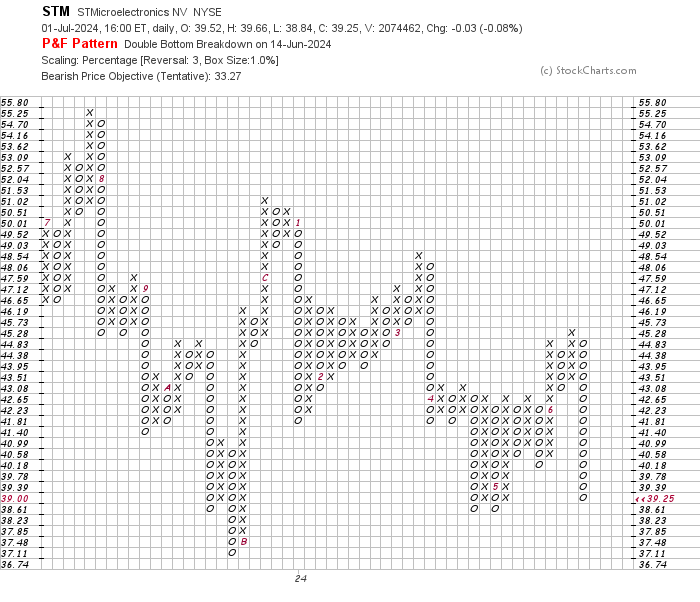
In this daily Point and Figure chart of STM below, I can see a downside price target in the $33 area.
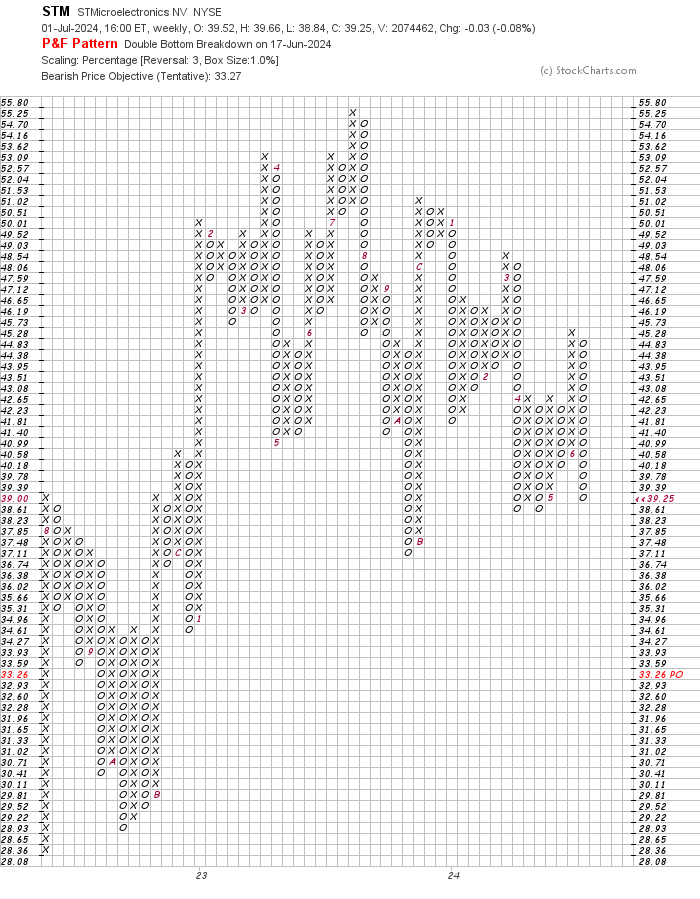
In this weekly Point and Figure chart of STM below, I can see that the software has projected a potential downside price target in the $33 area.
Bottom line strategy: Traders should avoid purchases of STM as further declines look likely in the weeks ahead.
Employees of TheStreet are prohibited from trading individual securities.