ASML Gaps Lower as High-Tech Chipmaking Machines Stay Home
Let's check out the charts of this key semiconductor stock.
You've reached your free article limit
You've read 0 of 1 free Pro articles.
Semiconductor maker ASML Holding N.V. ASML is trading sharply lower in early trading Tuesday after Netherlands' move to curb some exports to China. Reports say that ASML canceled shipments of some high-end chipmaking machines to China at the request of the Biden administration.
Let's check out the charts.
In the daily bar chart of ASML, below, I can imagine an opening in the $748 area. Looking closely at the chart below I can see that the high price was made on December 26 and a close below that day's low will be "a close below the low of the high day." This is a quick-turning sell signal that I learned about on a hedging desk in the mid-1980s. It can be the start of a turn to the downside.
The shares have soared higher since late September. ASML trades above the rising 50-day moving average line and above the rising 200-day moving average line. The 50-day line has also crossed above the 200-day line for a belated golden cross buy signal.
The daily On-Balance-Volume (OBV) line turned higher from late September but turned sideways in December. The Moving Average Convergence Divergence (MACD) oscillator is above the zero line but poised for a downside crossover and take profit sell signal.
In the weekly Japanese candlestick chart of ASML, below, I can see that the three most recent weekly candles have made three-quarters of a top reversal pattern. A bearish (red) candle pattern this week will confirm a top reversal. The shares are still well above the rising 40-week moving average line but that is a lagging indicator.
The weekly OBV line shows both improvement the past three months but also a recent sideways trend. The MACD oscillator is above the zero line in an outright buy signal.
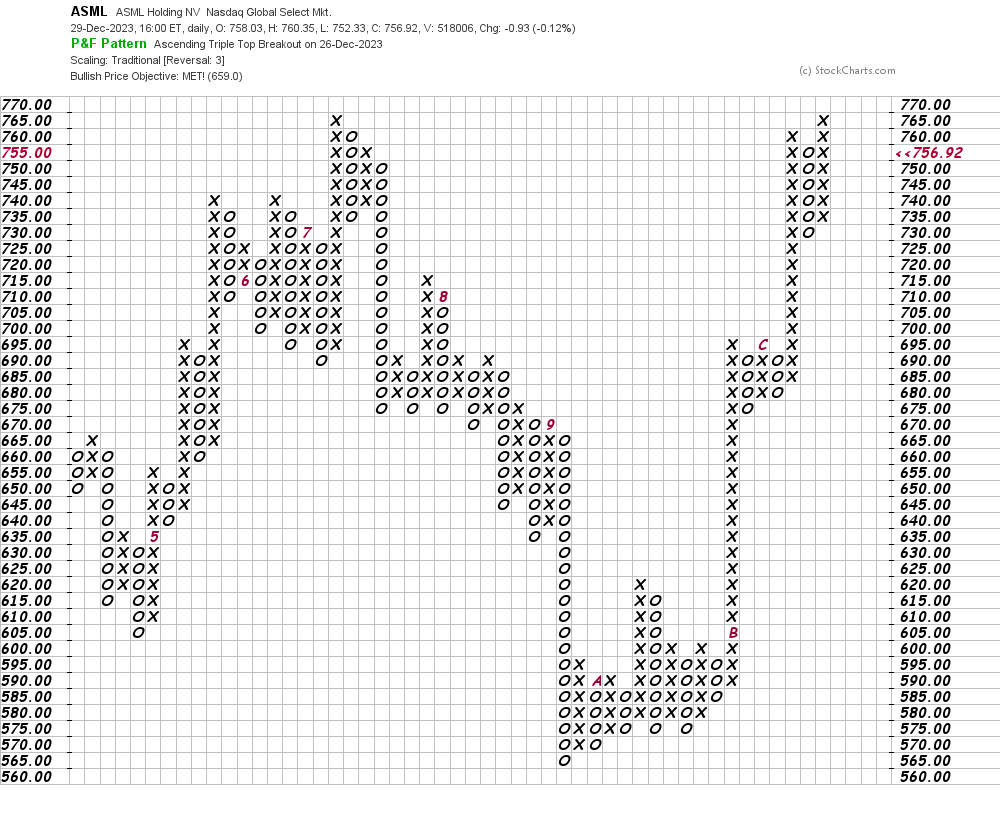
In this daily Point and Figure chart of ASML, below, I can see that prices reached and exceeded an upside price target in the $659 area.
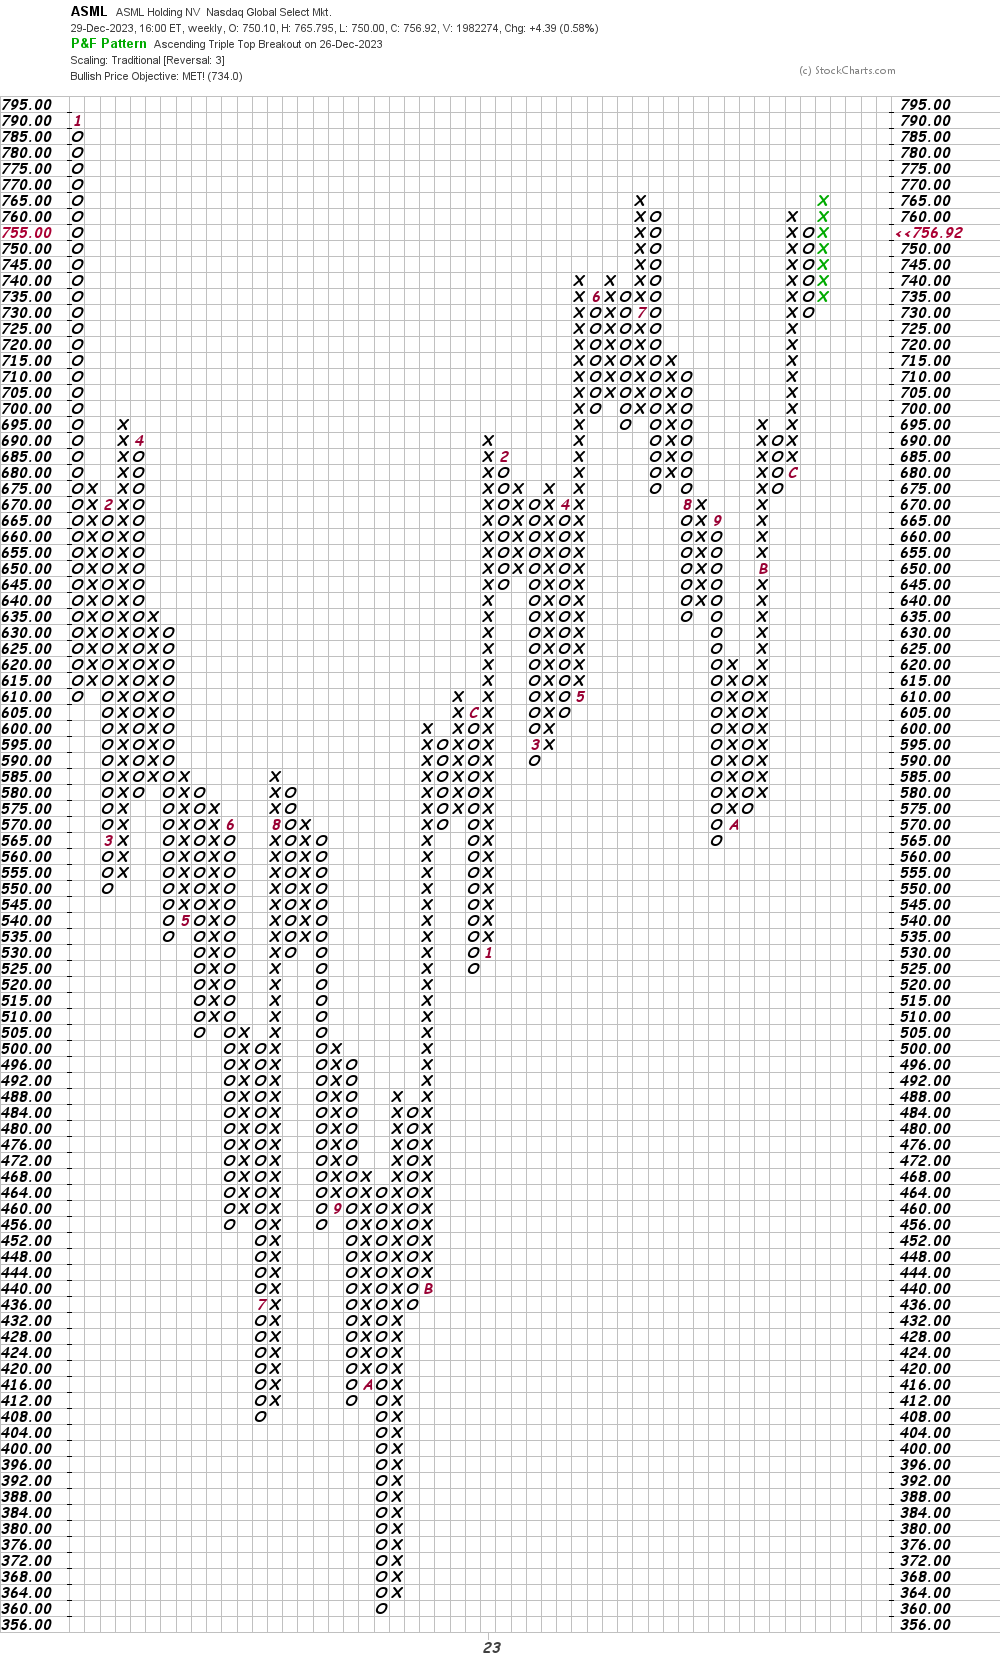
In this second Point and Figure chart of ASML, below, I used weekly price data. Here the software shows us that the shares have reached and exceeded a price target in the $734 area.
Bottom-line strategy: When prices are stretched to the upside the introduction of bearish news can have an outsized effect. Avoid the long side of ASML.
Employees of TheStreet are prohibited from trading individual securities.