As AbbVie Drug Gets FDA Nod, Traders Can Look Up to These Targets
Here's where I see the drugmaker going after Skyrizi win.
You've reached your free article limit
You've read 0 of 1 free Pro articles.
AbbVie ABBV on Wednesday won Food and Drug Administration approval for a new use for its drug Skyrizi for adults with moderately to severely active ulcerative colitis. Let's visit with the charts and indicators to see the trends and potential targets.
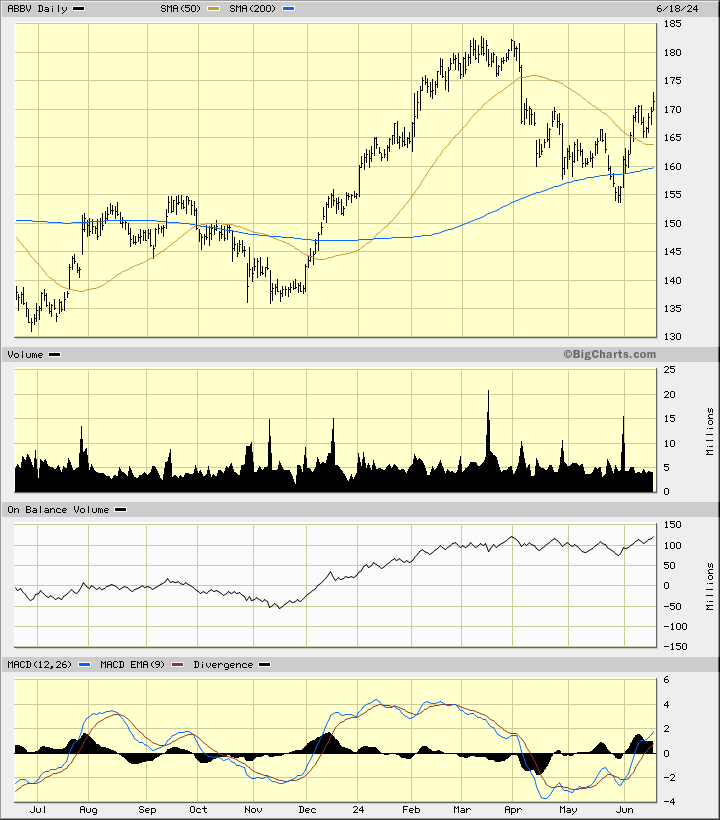
In this daily bar chart of ABBV, below, I can see that prices are now trading above the bottoming 50-day moving average line and above the rising 200-day moving average line. Trading volume has been active since November, but does not show a pattern of increasing turnover as the rally goes on.
The On-Balance-Volume (OBV) line does show me a move to a new high which is leading the price action. The OBV line is both a coincident indicator and at times a leading indicator. The trend-following Moving Average Convergence Divergence (MACD) oscillator moved back above the zero line in June for an outright buy signal.
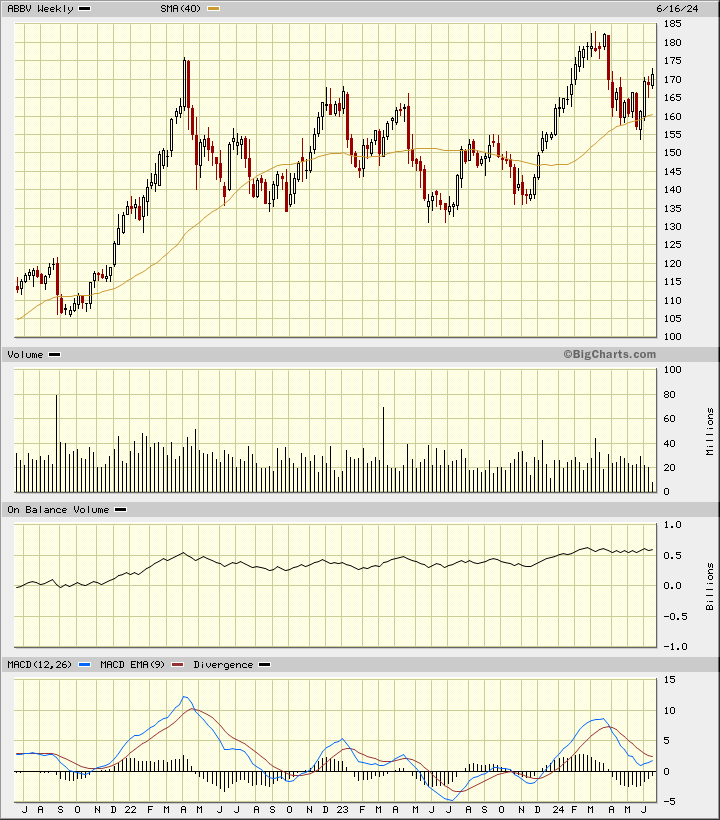
In this weekly Japanese candlestick chart of ABBV, below, I can see that prices are higher today than they were three years ago. The recent pullback and retest of the 40-week moving average line could be a buying opportunity. The weekly OBV line shows me a new rising pattern since the beginning of 2024. The Moving Average Convergence Divergence oscillator has been narrowing in recent weeks and is close to an upside crossover and buy signal.
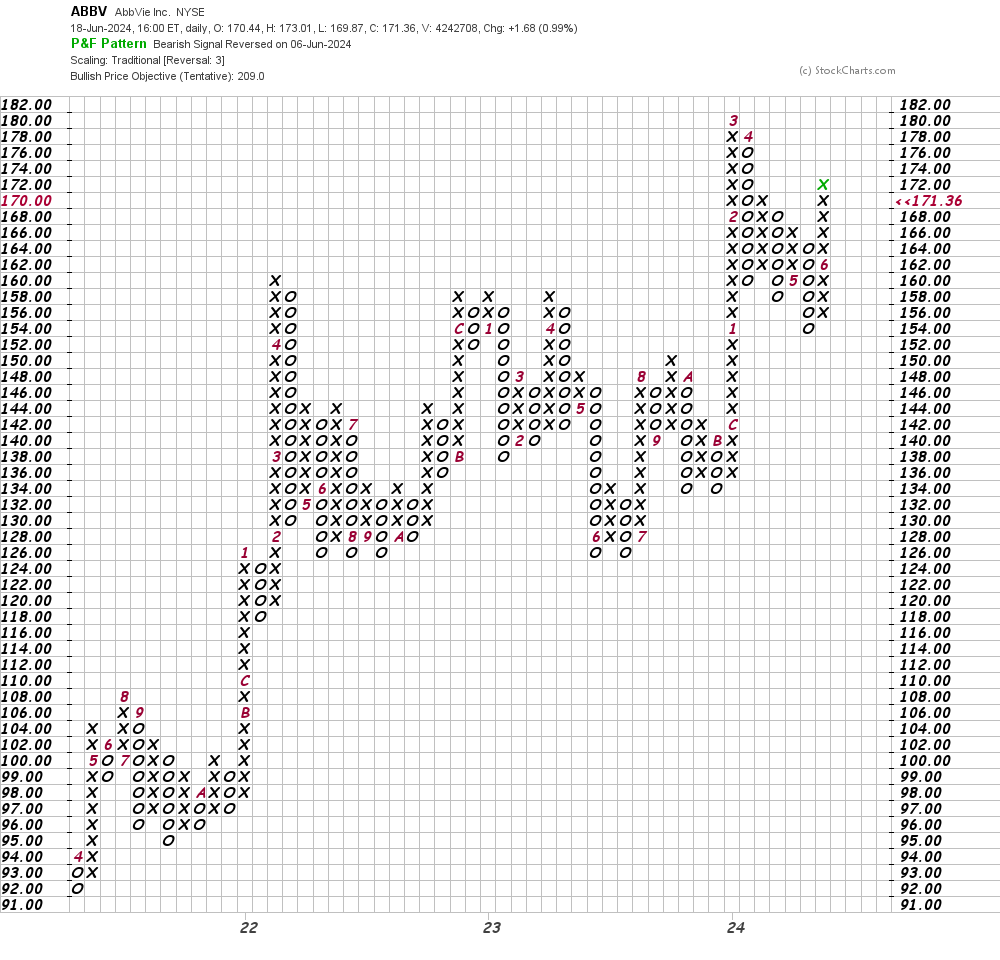
In this daily Point and Figure chart of ABBV, below, I can see that the software is suggesting an upside price target in the $209 area.
In this weekly Point and Figure chart of ABBV, below, I can see a target in the $203 area.
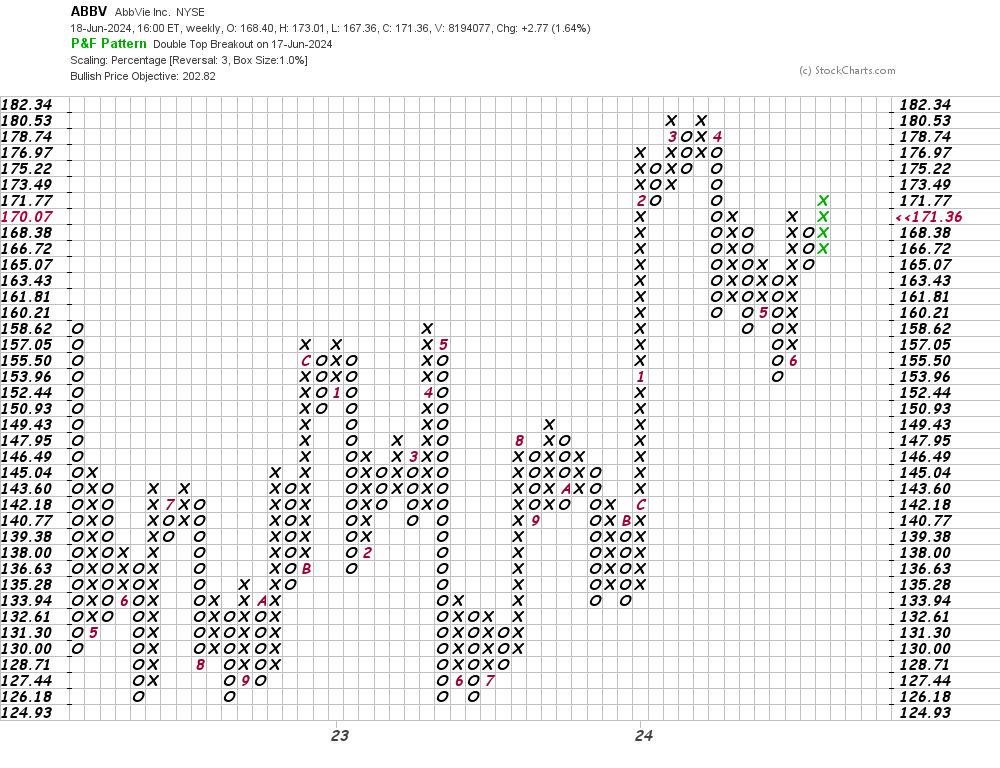
Bottom line strategy: Traders could go long ABBV around $170 risking to $160. The $203-$209 area is my price target for now.
Employees of TheStreet are prohibited from trading individual securities.