Arrowhead Pharmaceuticals Looks Likely to Fall Further
The clinical-stage company could be set to break new lows in the weeks ahead.
You've reached your free article limit
You've read 0 of 1 free Pro articles.
Arrowhead Pharmaceuticals ARWR is a clinical-stage company "developing medicines that treat intractable diseases by silencing the genes that cause them."
Let's check out the charts and indicators.
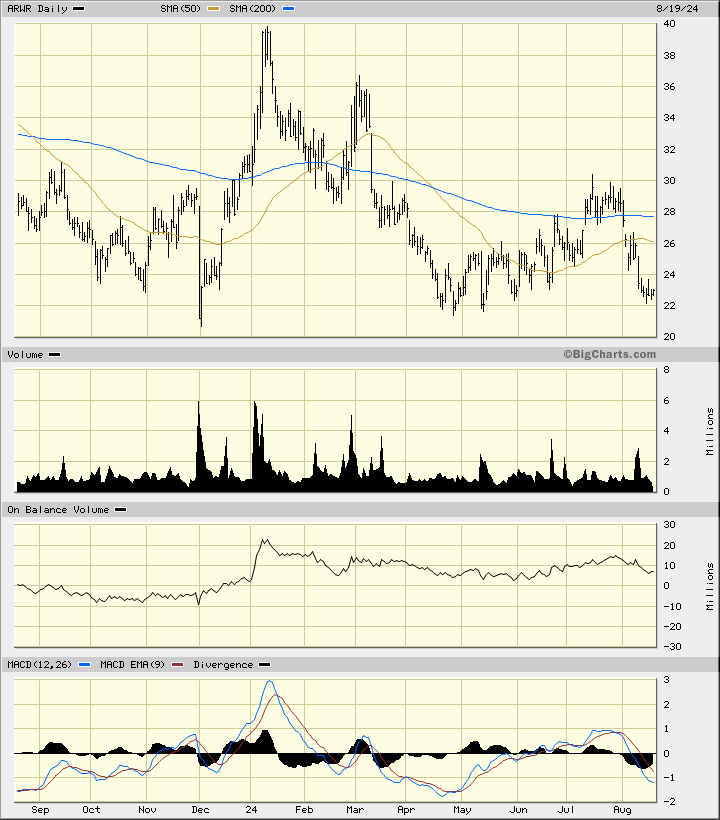
In this daily bar chart of ARWR below, I can see that prices have made some upside rallies but it has made more downside declines. Prices have been testing the $22 to $20 area since December and I am not all that confident that this tentative zone of buying interest will be able to repel sellers. Prices trade below the declining 50-day moving average line and the declining 200-day moving average line. The On-Balance-Volume (OBV) line has been showing weakness since late July. The Moving Average Convergence Divergence (MACD) oscillator is below the zero line — not a positive development.
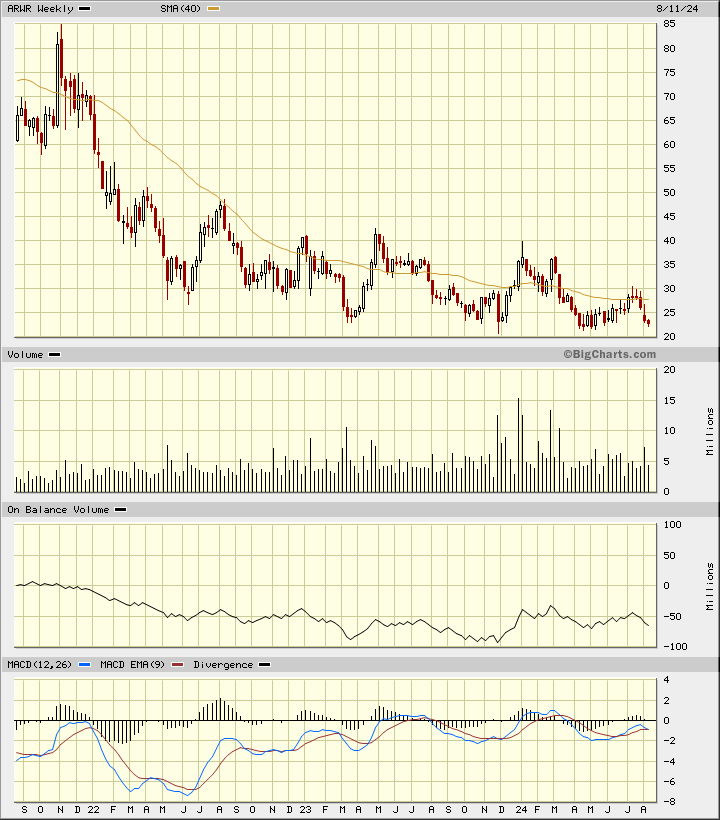
In this weekly Japanese candlestick chart of ARWR below, I can see a mostly bearish development. Prices trade below the declining 40-week moving average line. Prices made new lows in May which means a durable bottom has not yet emerged. The weekly OBV line has moved sideways since early 2023. The MACD oscillator is below the zero line and crossing to the downside.
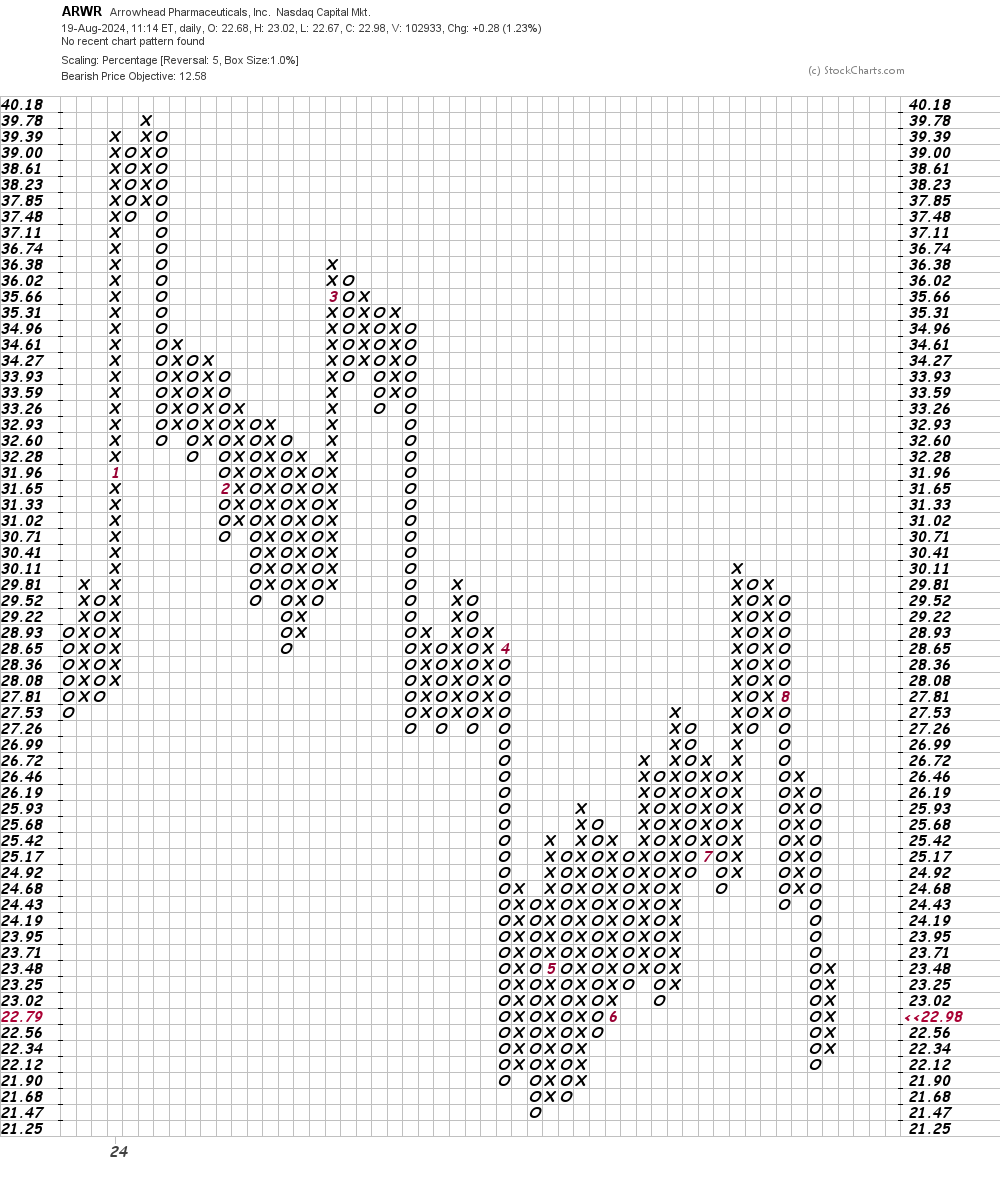
In this daily Point and Figure chart of ARWR below, I can see a potential downside price target in the $13 to $12 area.
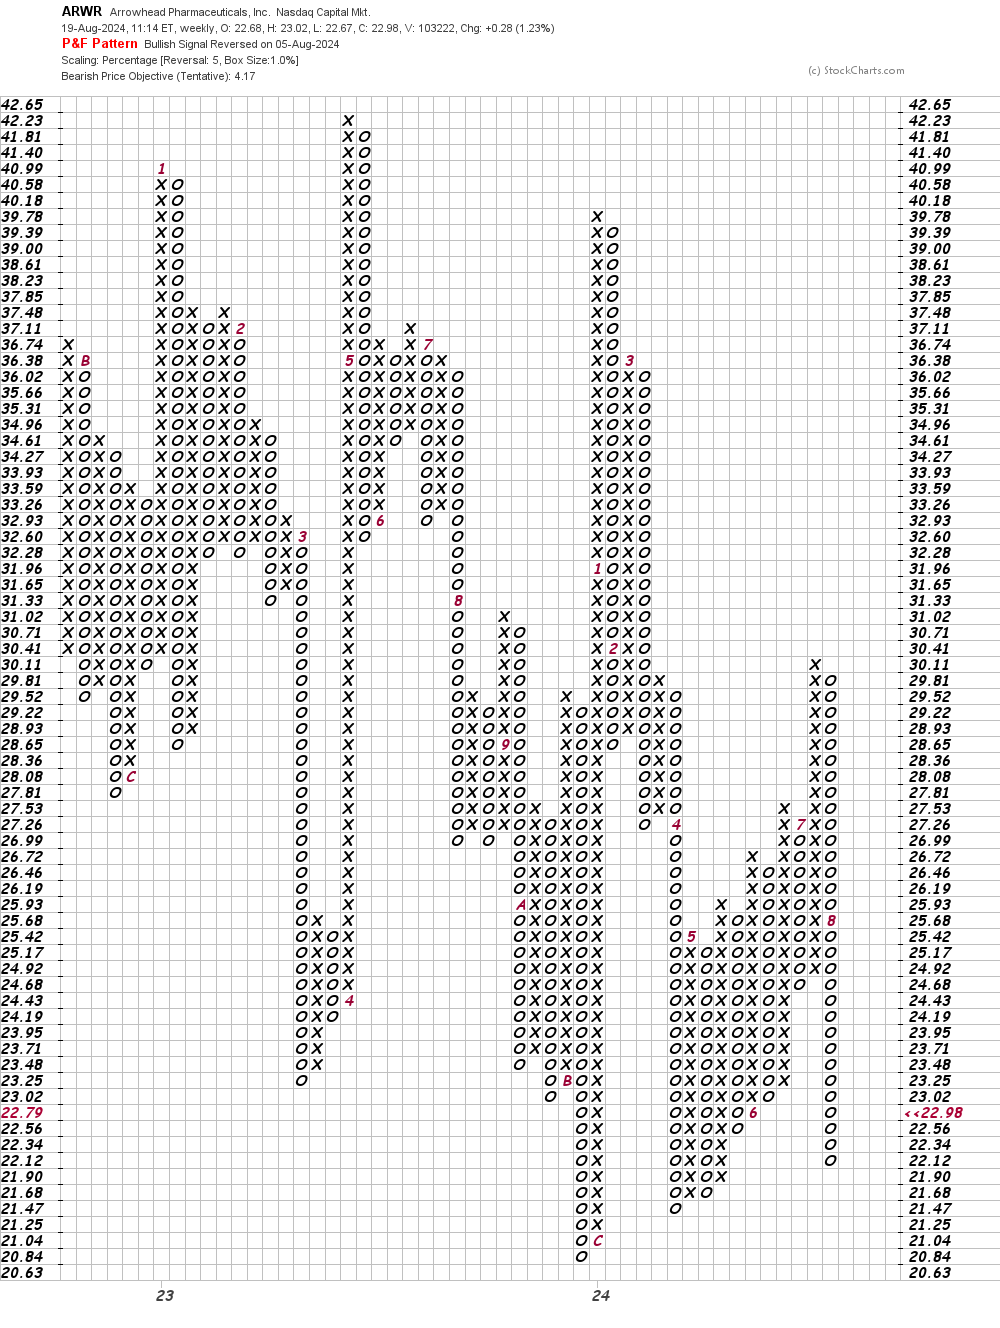
In this weekly Point and Figure chart of ARWR below, I used a five-box reversal filter. Here the software gives us a price target in the $5 to $4 area.
Bottom line strategy: ARWR could bounce to the upside but I am not confident that the $25 to $20 area will hold. The risk in my mind is that ARWR breaks to new lows in the weeks ahead.
Employees at TheStreet are prohibited from trading individual securities.