Arm Holdings May Need to Hold This Chart Area — Or Else
When a stock corrects half of its advance, the bulls are now on the defense.
You've reached your free article limit
You've read 0 of 1 free Pro articles.
Wednesday night after the close of trading Arm Holdings ARM reported its latest financial results. They beat top-line and bottom-line estimates but the stock began to slide as the results and guidance failed to live up to lofty expectations.
Let's move from the fundamental story to the charts and technical indicators.
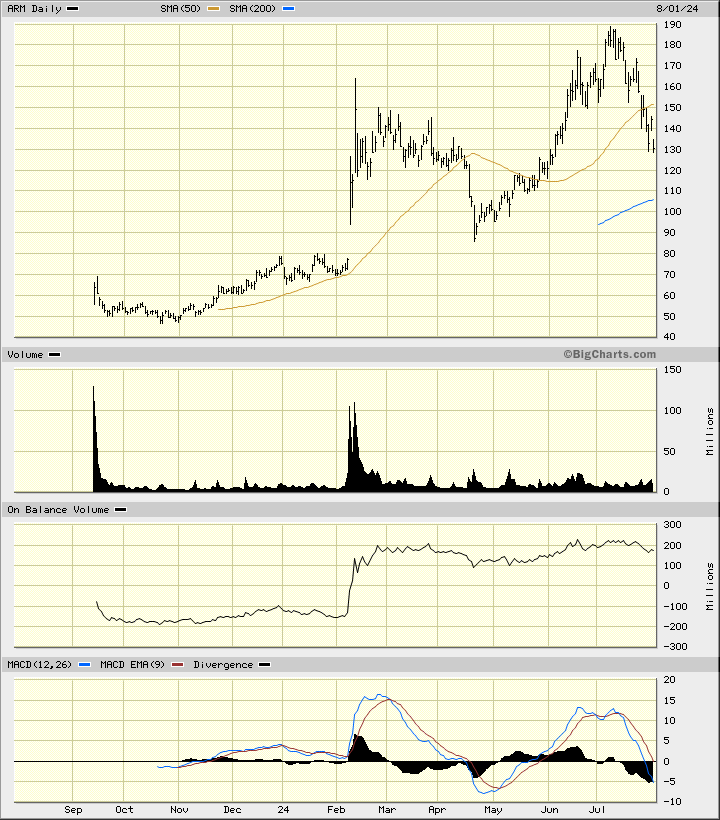
In the daily bar chart of ARM, below, I can see that the shares have declined below the 50-day moving average line and retraced more than half of the prior advance. When I see a stock that corrects half of its advance I start to think that the bulls are now on the defense. The rising 200-day line intersects around $105. A break of the 200-day line is rarely a good thing and it could precipitate further weakness.
The On-Balance-Volume (OBV) line has rolled over the past six or seven weeks. The Moving Average Convergence Divergence (MACD) oscillator is weak and crosses below the zero line.
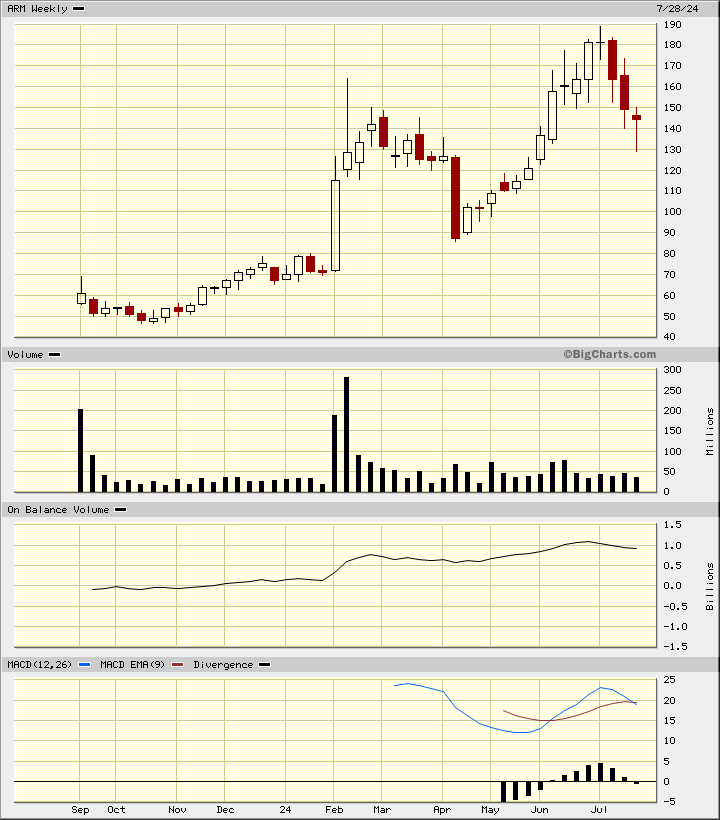
In the weekly Japanese candlestick chart of ARM, below, we don't have our usual three years of history but we have enough to draw some conclusions. I see a very clear doji pattern at the beginning of July. Prices have turned lower and I can see a string of red (bearish) candles.
The weekly OBV line is edging lower and the MACD oscillator is crossing to the downside.
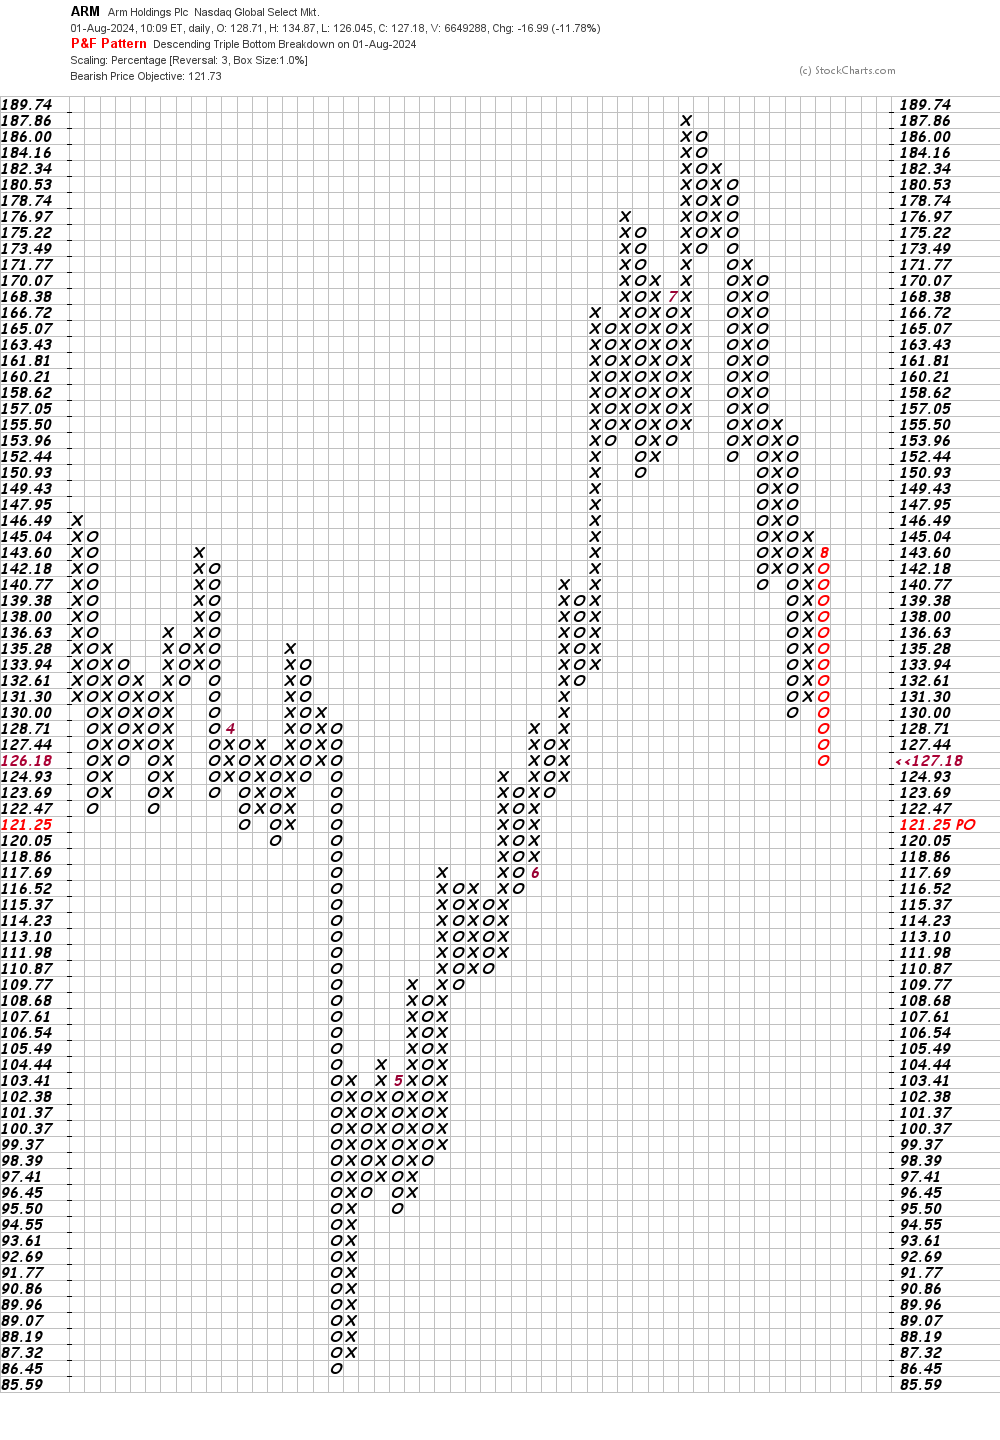
In this daily Point and Figure chart of ARM, below, I can see a downside price target in the $122 area.
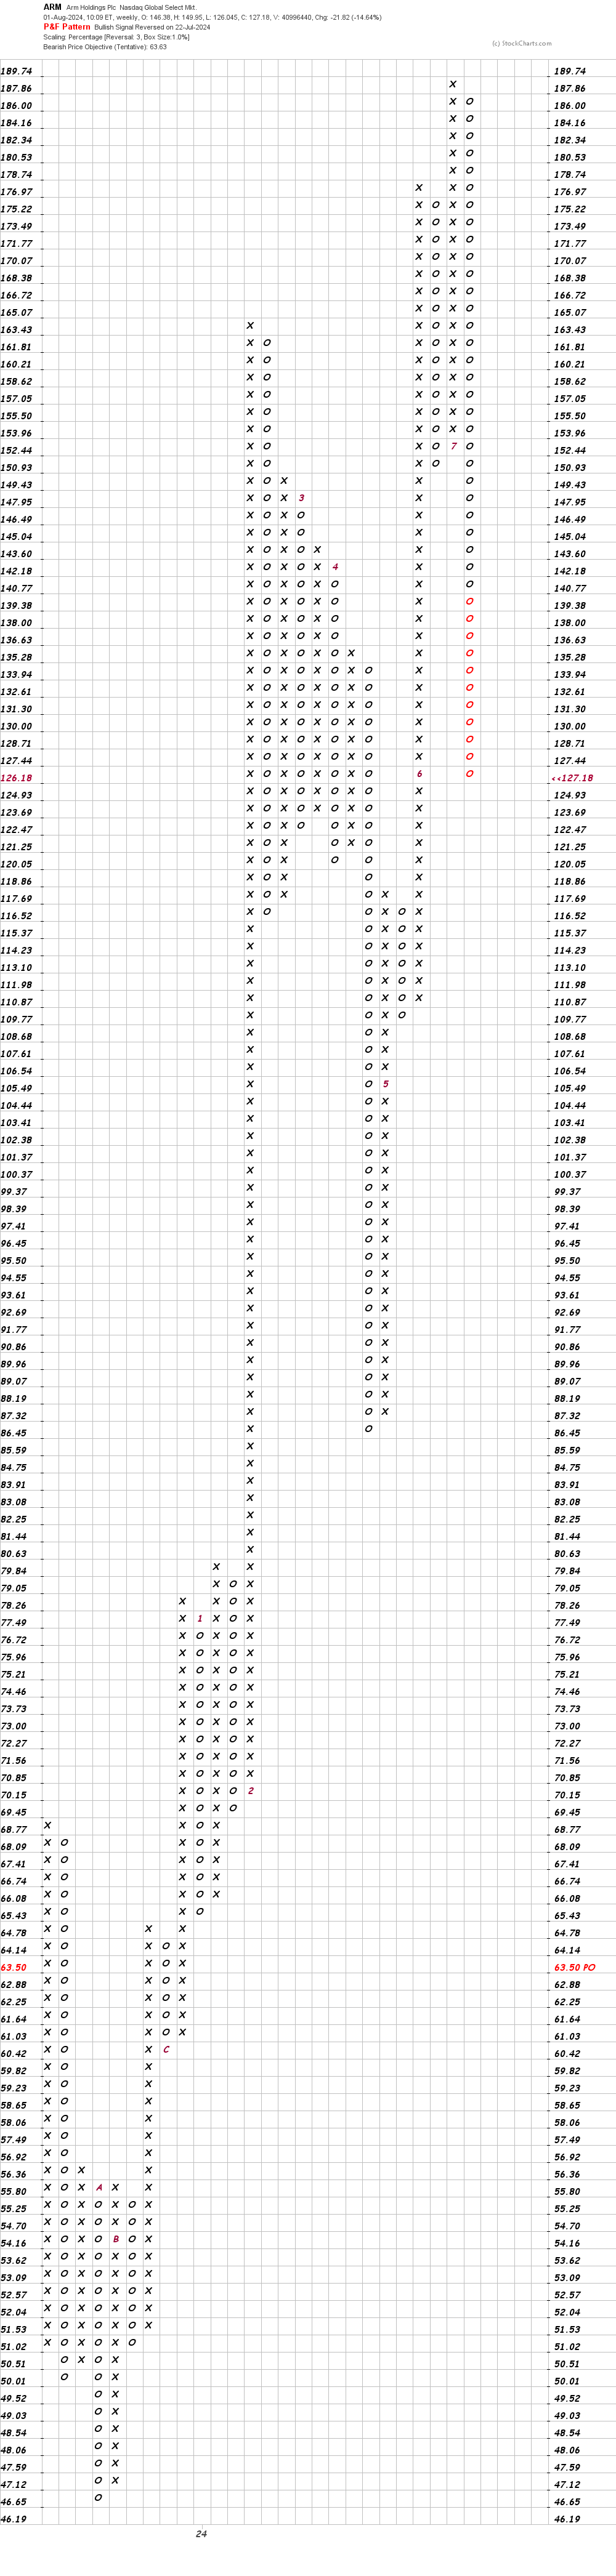
In this weekly Point and Figure chart of ARM, below, I can see a downside target in the $64 area. Ouch.
Bottom-line strategy: A break below the rising 200-day moving average line around $105 should convince more traders to sell.
Employees of TheStreet are prohibited from trading individual securities.