Apple's Decline Spells Opportunity, but Traders Must Watch These Key Levels
Rather than focus on the negative of the iPhone maker's slipping stock price, consider where it might be a good place to buy.
You've reached your free article limit
You've read 0 of 1 free Pro articles.
They say never fall in love with a stock. It's just a piece of paper. Flip that paper for a profit and move on.
This is actually good advice. Many investors have gone down with the ship because they allowed their emotions to get the best of them.
However, there are companies that make sense for the long haul. Companies with compelling futures. Companies that you want to hold for decades and leave to your heirs.
Apple AAPL fits that description. The Action Alerts PLUS portfolio holding has gained nearly 400% since the start of 2019, but the stock is currently caught in a spiral. However, instead of focusing on the negative of a falling stock price, let's focus on the opportunity that a falling price creates.
In my investment account, I'm long Apple and have no intention of selling. Here are Apple's returns for the past five years:
2019: +86.16%
2020: +80.75%
2021: +33.82%
2022: -26.83%
2023: +48.18%
In my trading account, I sold Apple some time ago. I missed some gains and also missed the current pullback.
Maybe you'd like to buy Apple for a trade or maybe for a long-term investment, but you're wondering, "What is the right price to buy the stock?" Let's go to the chart to find out.
Apple Inc. (AAPL)
View Chart »View in New Window »
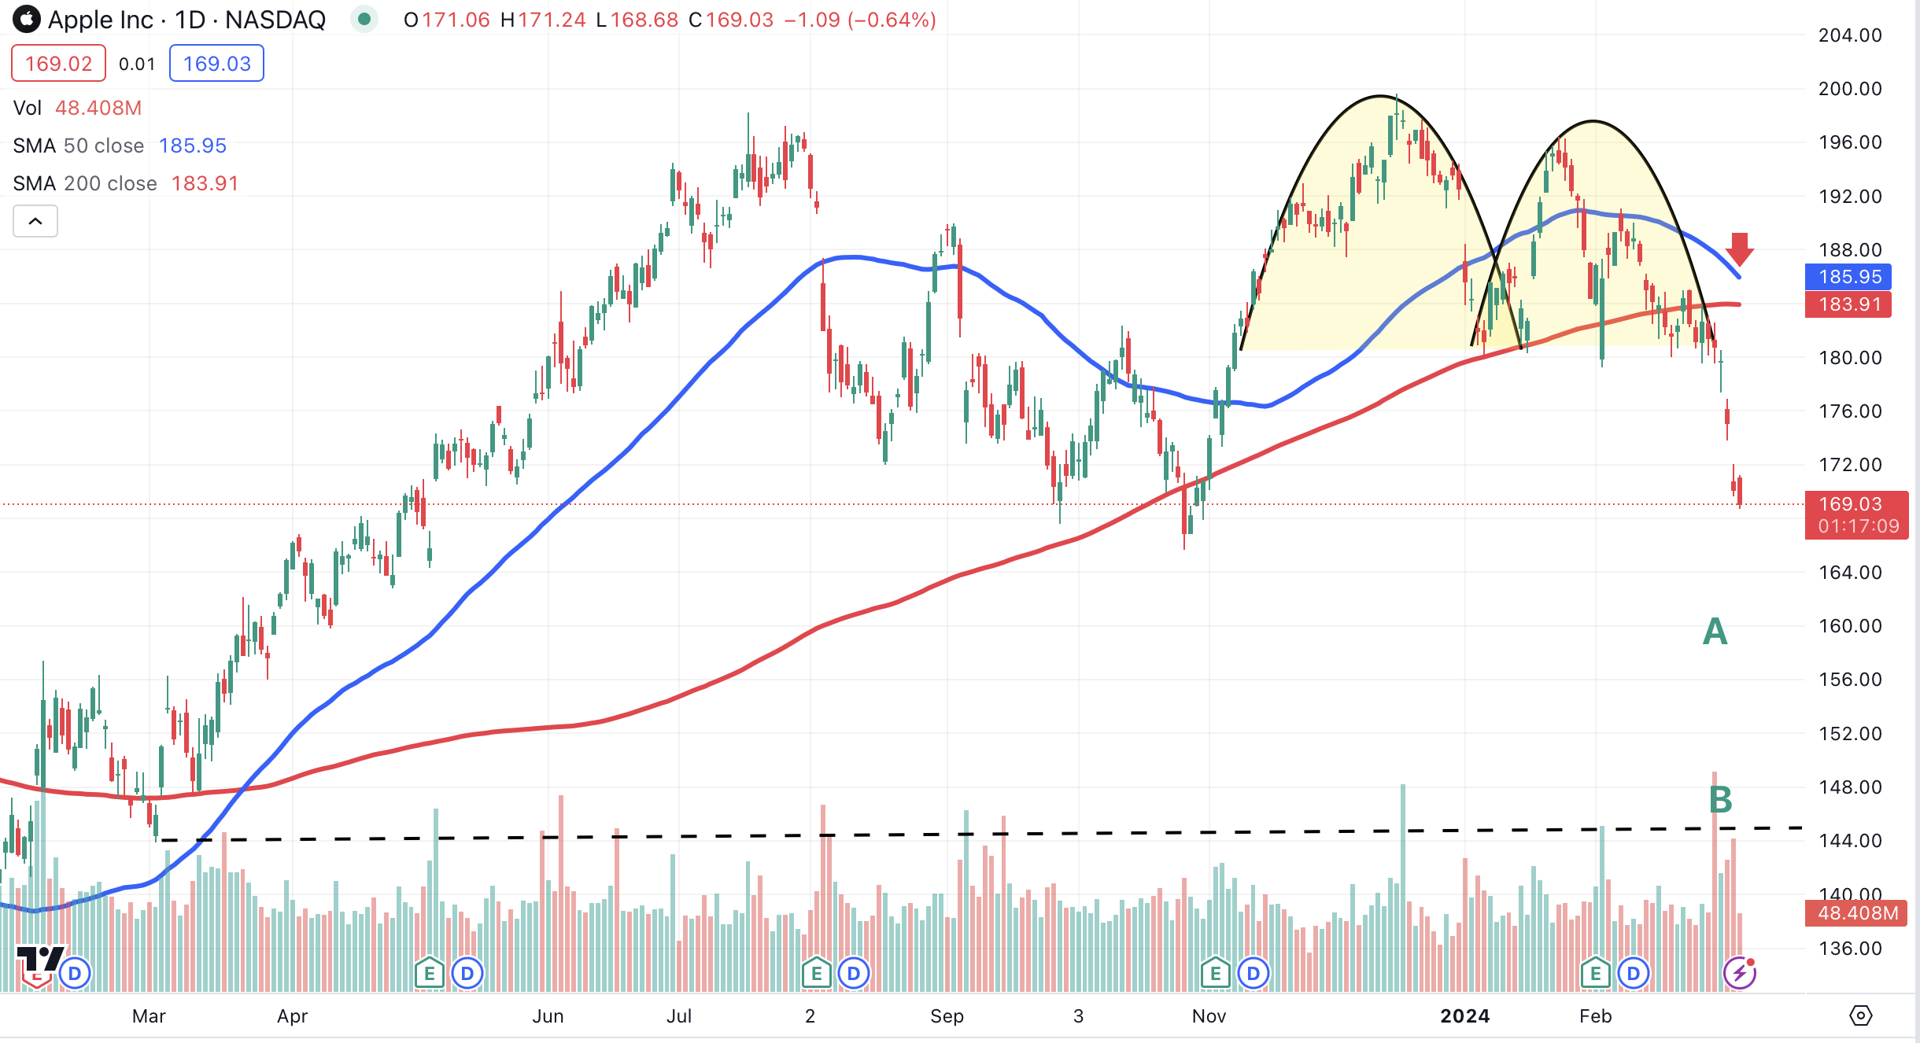
Apple has broken down from a bearish double top pattern. That double top measures $20 from top to bottom ($200 to $180). If we add $20 to the bottom of the pattern, the result is $160 (point A). That would be my initial entry point.
I wouldn't necessarily go all in at that price. There's another area of support near $145 (point B), left over from March (black dotted line). Keep some powder dry in case the price falls to this level.
One sign that Apple is likely to continue falling is contained within its 50-day (blue) and 200-day (red) moving averages. Those key averages appear ready to cross (red arrow), a sign of negative momentum.
Although the news surrounding Apple has been bleak in recent weeks -- iPhone sales have dropped by 24% in China and the company this week was hit with a nearly $2 billion fine by the European Commission for allegedly violating laws governing competition in the music streaming business -- this isn't the first time the company has dealt with uncertainty.
Apple has a habit of buying its own shares after a big decline, thereby reducing the supply of shares on the market. Recently, it was reported that the company has $162.1 billion in cash on hand. That cash could act as a cushion in the event of a sharp pullback, which is one more reason to own the stock.
(AAPL is a holding of Action Alerts PLUS. Want to be alerted before the portfolio buys or sells these stocks? Learn more now.)
At the time of publication, Ponsi was long AAPL.
