Apple: Maybe It's a Good Time to Sit Things Out for a While
'Own It, don't trade it', should perhaps be, 'where should I buy it?'
You've reached your free article limit
You've read 0 of 1 free Pro articles.
Shares of Apple AAPL soared higher Friday after they reported their Q2 results Thursday night which topped expectations despite iPhone fears. The technology giant also unveiled a record breaking $110B buyback program.
Could the news get any better?
Let's check out the charts and indicators as the TV pundits ask "is the bull case for Apple back?"
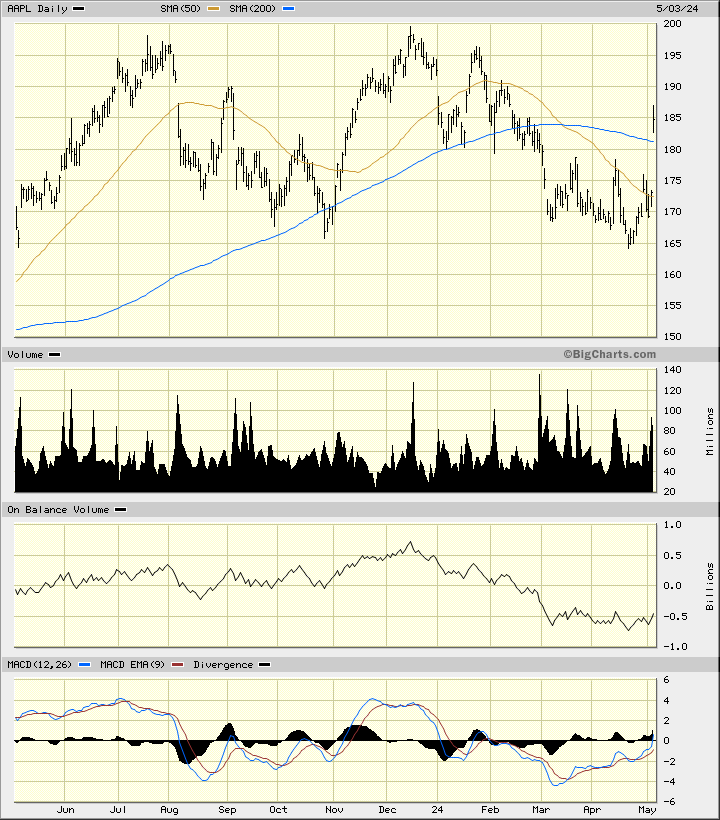
In this daily bar chart of AAPL, below, I can see that prices gapped above the 50-day moving average line and above the 200-day moving average line. Pretty dramatic. The daily trading volume looks like it has been more active in the past two months than earlier in the year.
The On-Balance-Volume (OBV) line moved in a sideways to lower trend in the past two weeks suggesting that investors did not anticipate the news.
The Moving Average Convergence Divergence (MACD) oscillator has been improving since early March and is now back to the zero line. Trading volume so far on Friday is good but not "exceptional."
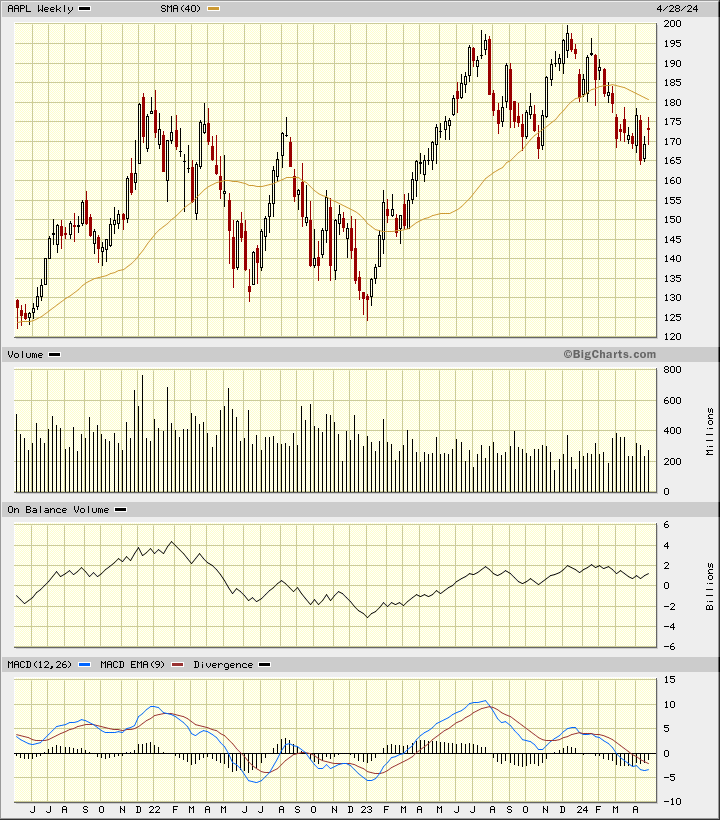
In this weekly Japanese candlestick chart of AAPL, below, I can see that prices have jumped back up above the declining 40-week moving average line. The candles did not give me a hint of a bottom reversal.
Trading volume is not giving me a buy message and the OBV line shows only modest strength in April. The MACD oscillator is in a bearish alignment below the zero line.
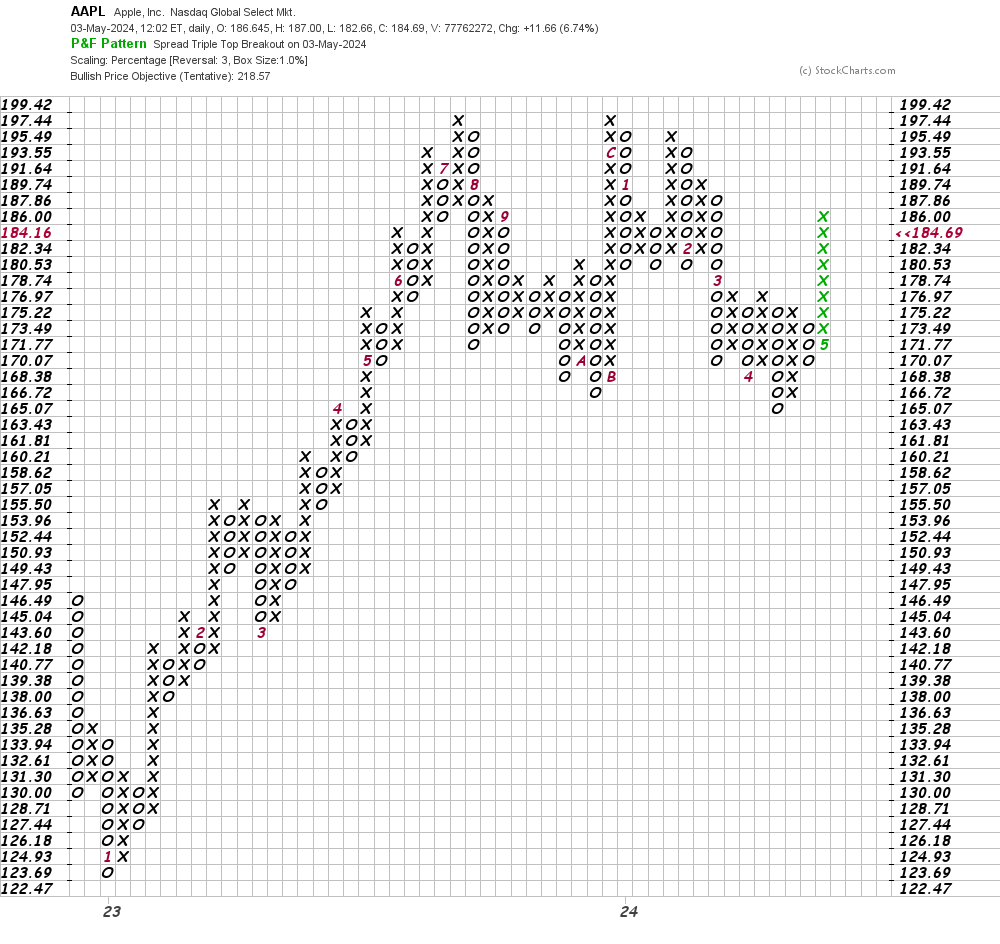
In this daily Point and Figure chart of AAPL, below, I can see a mixed picture. Prices have turned upwards and are shown here with no price gap. A price target in the $219 area is shown but there is a band of overhead resistance.
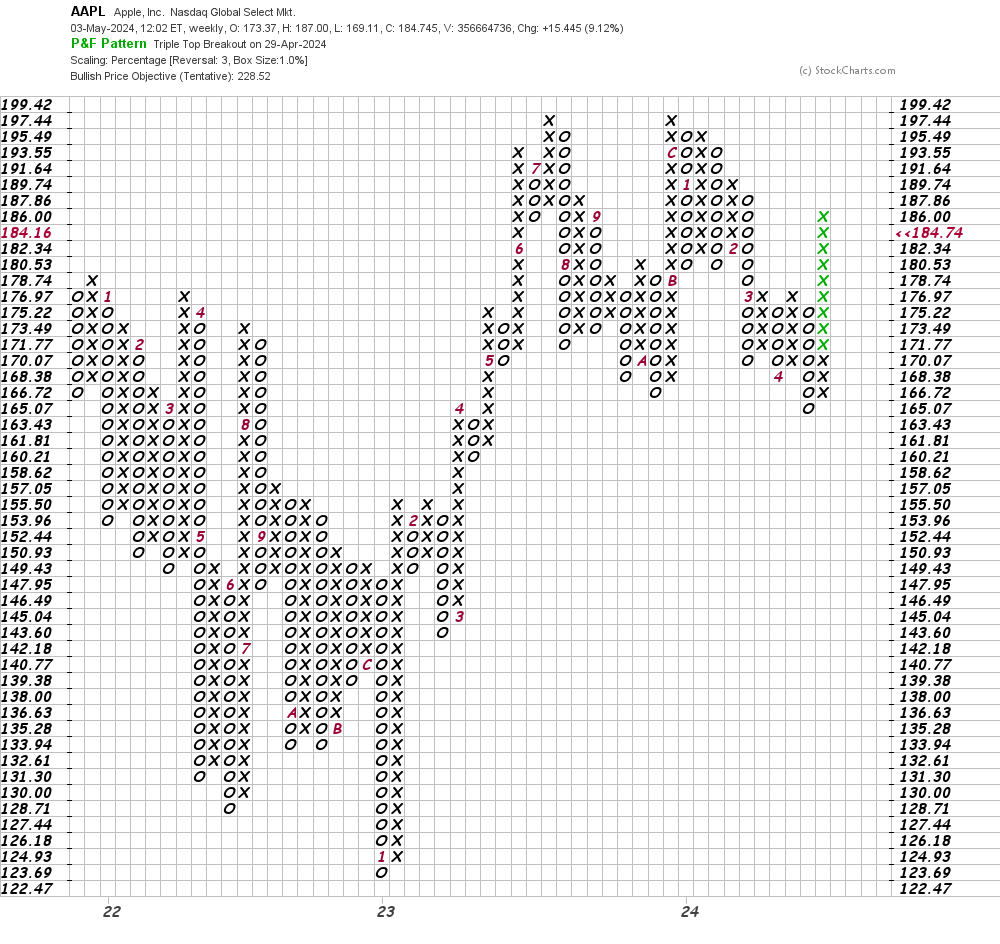
In this weekly Point and Figure chart of AAPL, below, I can see a potential upside price target in the $229 area.
Bottom line strategy: I know I am going to hear and read over the weekend the phrase "own Apple and don't trade it". Maybe the new phrase should be "I don't own Apple so where should I buy it?"
Looking closer at Friday's action I found that there were early sellers above $185 and buyers below $183.
When I look at a chart and consider whether it is a buy I always think about what I need to risk and where it can rally. For AAPL I think I would have to risk to- $165 and I am not sure what the upside target should be.
I am going to sit things out for a while.
Employees of TheStreet are prohibited from trading individual securities.