American Airlines Faces Critical Close After Guidance Cut
New profit guidance from the airline giant has sent shares tumbling and the next close might indicate where prices go next.
You've reached your free article limit
You've read 0 of 1 free Pro articles.
American Airlines AAL reported an adjusted profit guidance cut Wednesday morning. The company also fired its chief commercial officer, Vasu Raja.
Shares of AAL are trading lower in the immediate aftermath. Let's check out the charts and indicators.
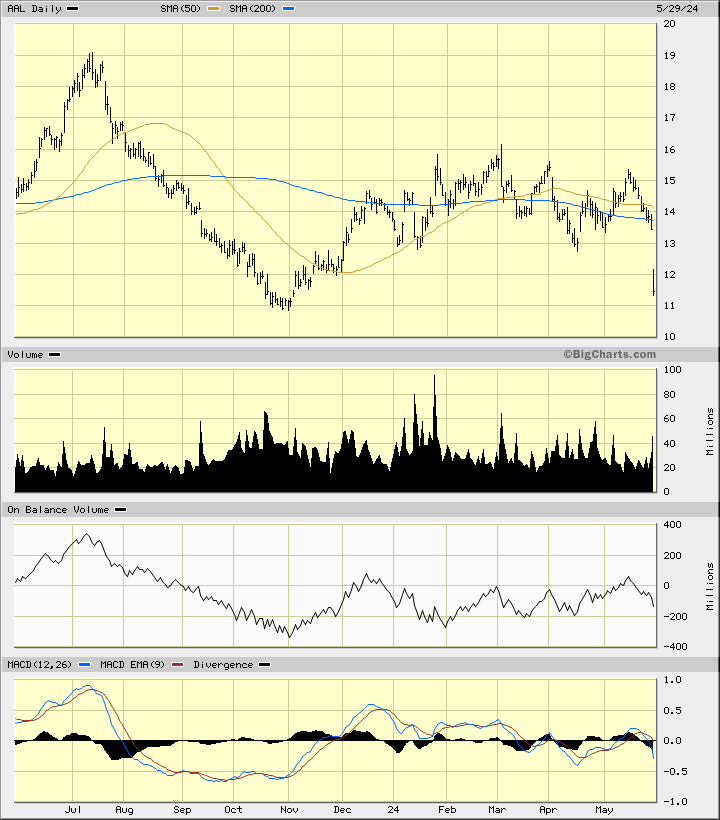
In this daily bar chart of AAL below, I can see that prices gapped lower. Prices trade below the 50-day and below the 200-day moving average lines.
Trading volume has increased and the On-Balance-Volume (OBV) line is set to make a new low for the move down. The Moving Average Convergence Divergence (MACD) oscillator has moved below the zero line for an outright sell signal. A retest of the October low is a possibility.
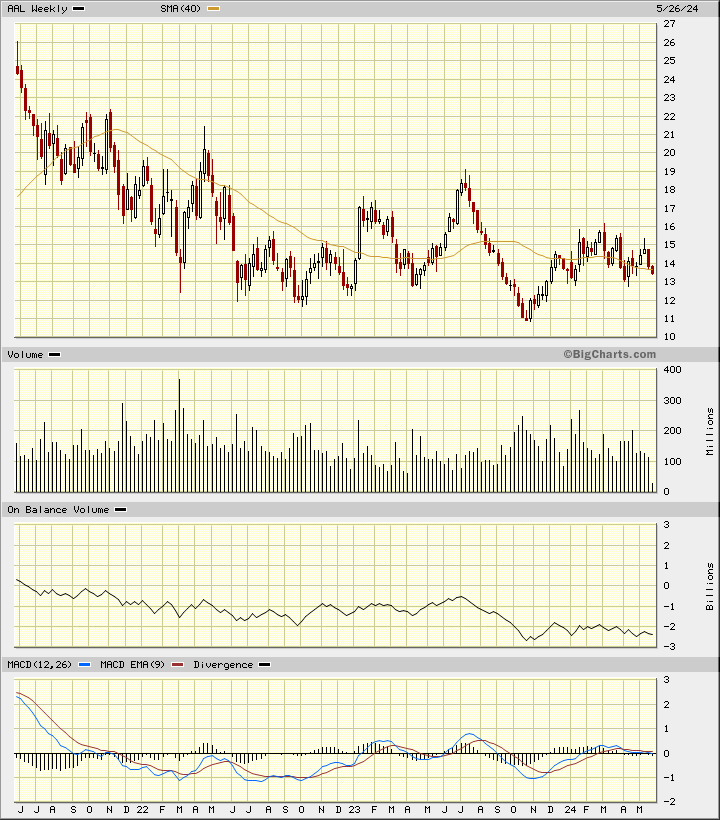
In the weekly Japanese candlestick of AAL below, I can use my imagination to figure out how the chart will look when Wednesday's action is finally plotted: AAL trades below the 40-week moving average line, the weekly OBV line is weak and the MACD oscillator is testing the zero line.
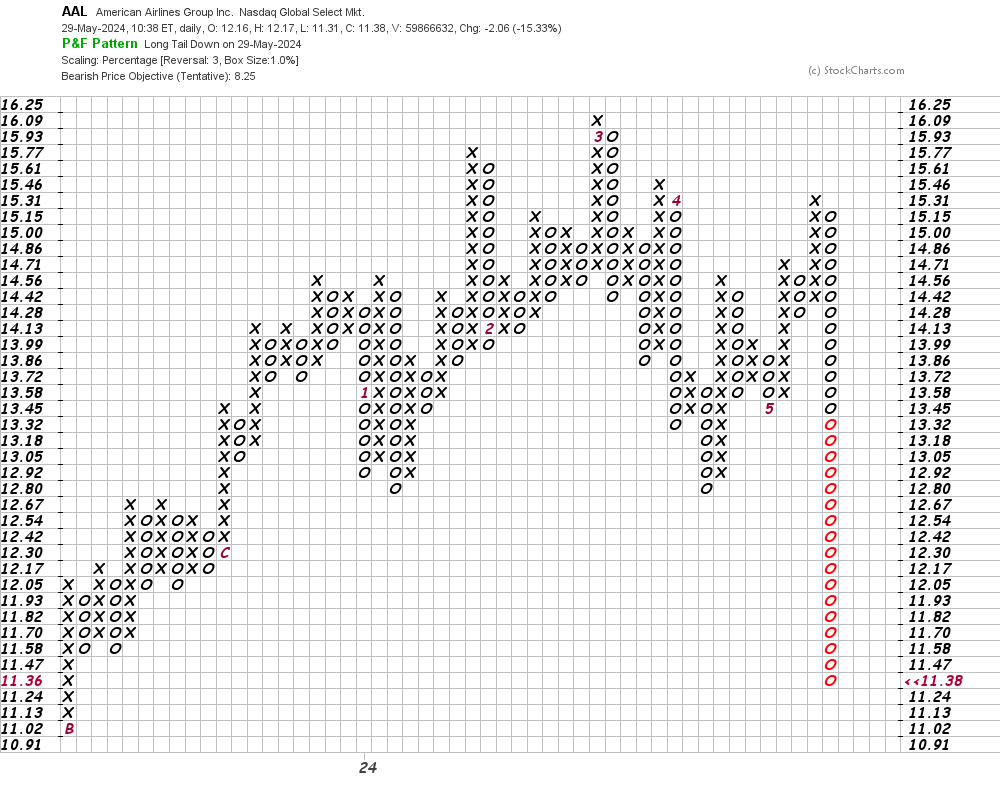
In this daily Point and Figure chart of AAL below, I can see today's decline with the gap filled in. Here, the software suggests a downside price target in the $8 area.
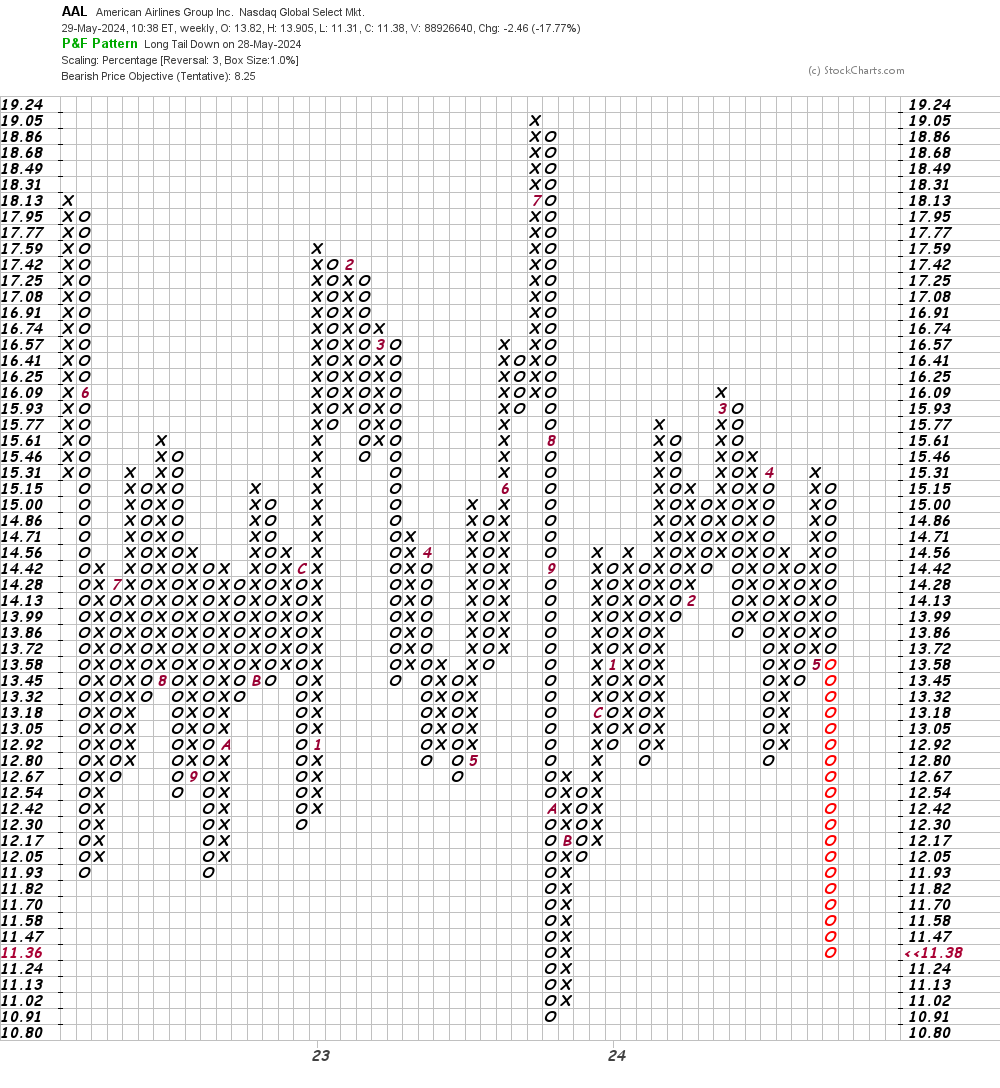
In this weekly Point and Figure chart of AAL below, I can see the same $8 price target as shown on the daily chart above.
Bottom-line strategy: Where do prices go from here? Could Wednesday's decline be a "one and done" selloff? Maybe. Could Wednesday's decline in AAL be the start of "leg lower"? Sure. A close below the October lows in the $11 area is likely to precipitate further declines in the weeks ahead.
Employees of TheStreet are prohibited from trading individual securities.