These Amazon Price Charts Raise Big Question for Traders
A deep dive into the Amazon charts raises more questions than answers, but we see some clear price targets emerging.
You've reached your free article limit
You've read 0 of 1 free Pro articles.
Online retailer Amazon AMZN has been a leader in e-commerce and also cloud services. Investments in infrastructure have hurt their profit numbers but AI, advertising and cloud services could help Amazon’s growth rebound. Bearish factors and bullish factors abound.
The charts and indicators tell a similar story — let's review them.
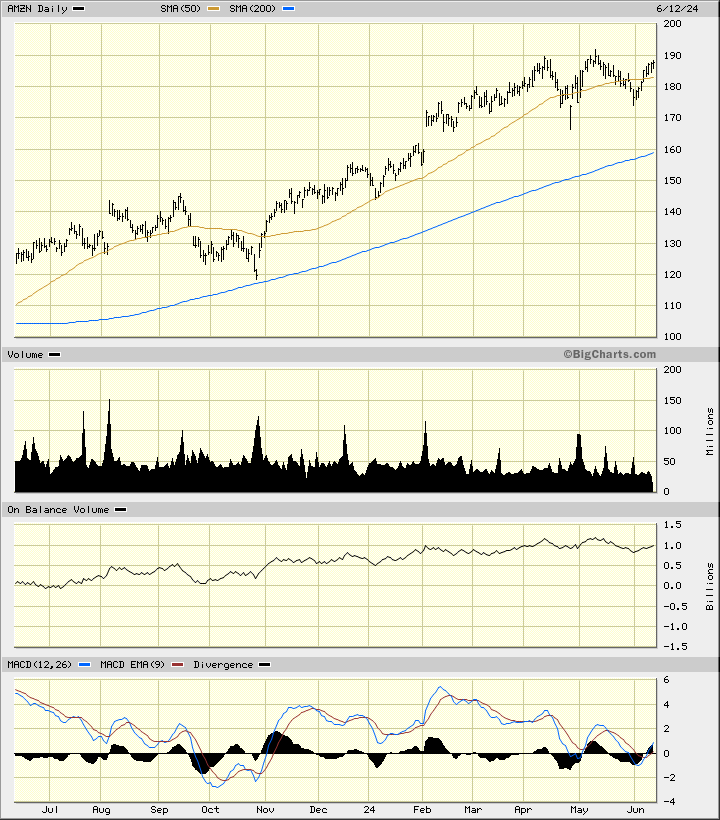
In this daily bar chart of AMZN below, I can see that prices have moved or traded sideways for the past three months. This price movement could be "read" as a small triple-top formation as prices have failed three times in the $190 area. Another analyst looking at the same chart could "read" it as a consolidation pattern that is likely to lead to higher prices when prices breakout to the upside. The trading volume has roughly declined and that fits more in line with a top pattern (investors tend to be early sellers in tops as they have large positions to unload). The On-Balance-Volume (OBV) line has made twin highs in April and May. The Moving Average Convergence Divergence (MACD) oscillator has weakened since February and this kind of weakness is typical at a market top.
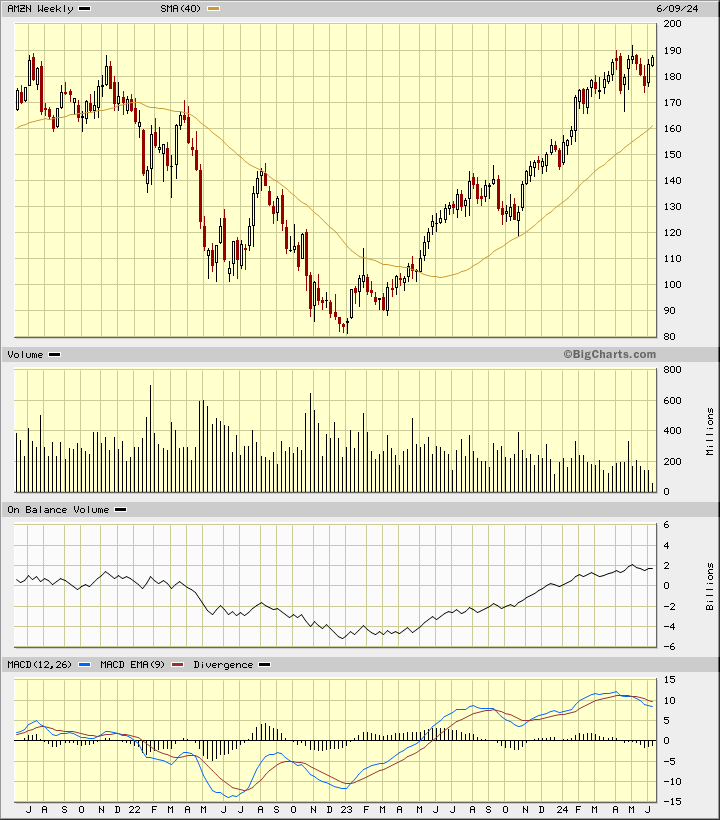
In this weekly Japanese candlestick chart of AMZN below, I see a mixed picture. Prices show us both some lower shadows and some upper shadows in the past three months. This tells us that traders are rejecting the highs and the lows, which argues in favor of a consolidation pattern instead of a major top reversal. A top reversal should show more upper shadows than lower shadows. The trading volume has been weakening over the past two years. The weekly OBV line shows us a strong rise but weakness beginning in May. The MACD oscillator has crossed to the downside in April to suggest that traders should be taking profits.
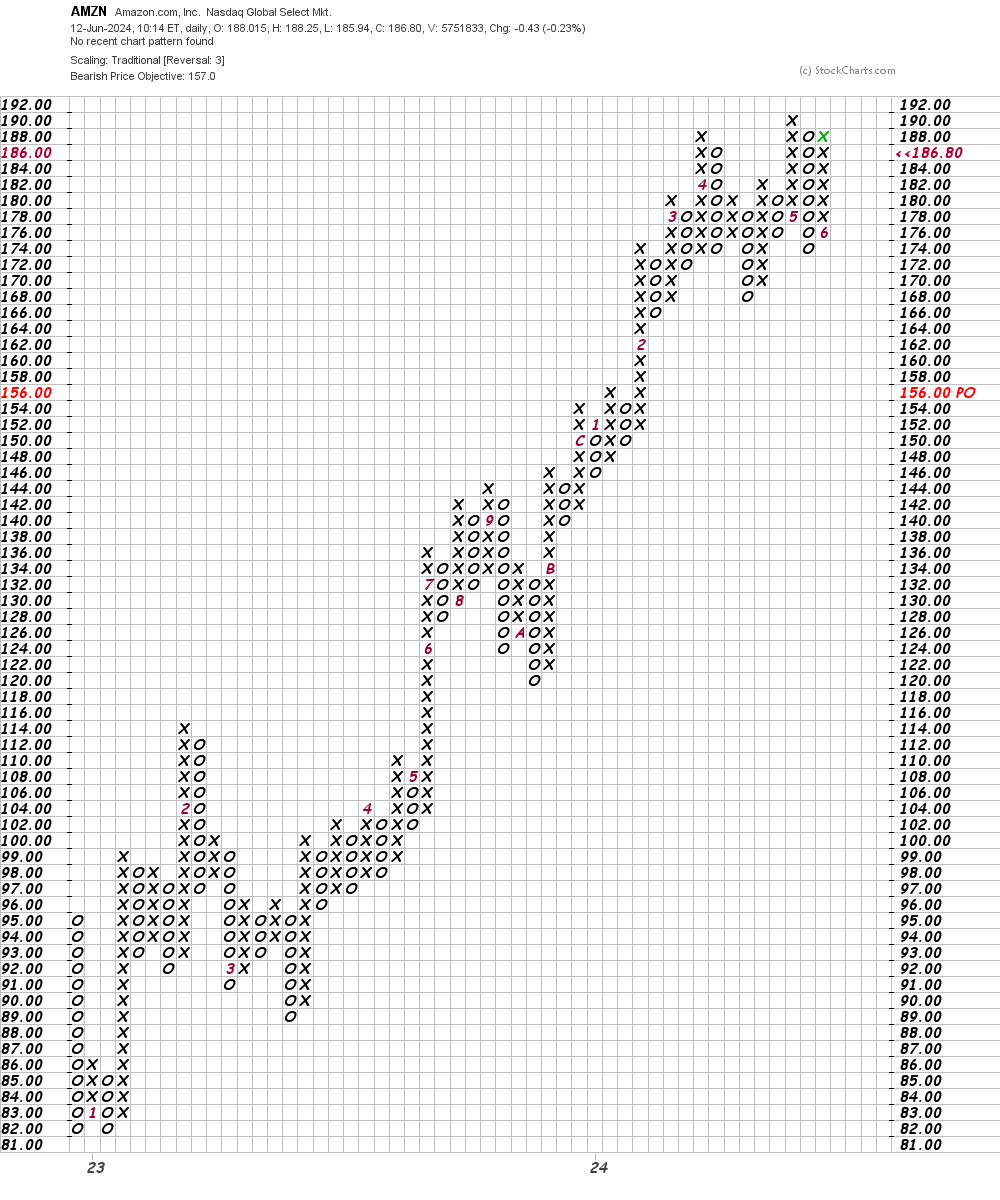
In this daily Point and Figure chart of AMZN below, the software is suggesting a bearish price target in the $157 area.
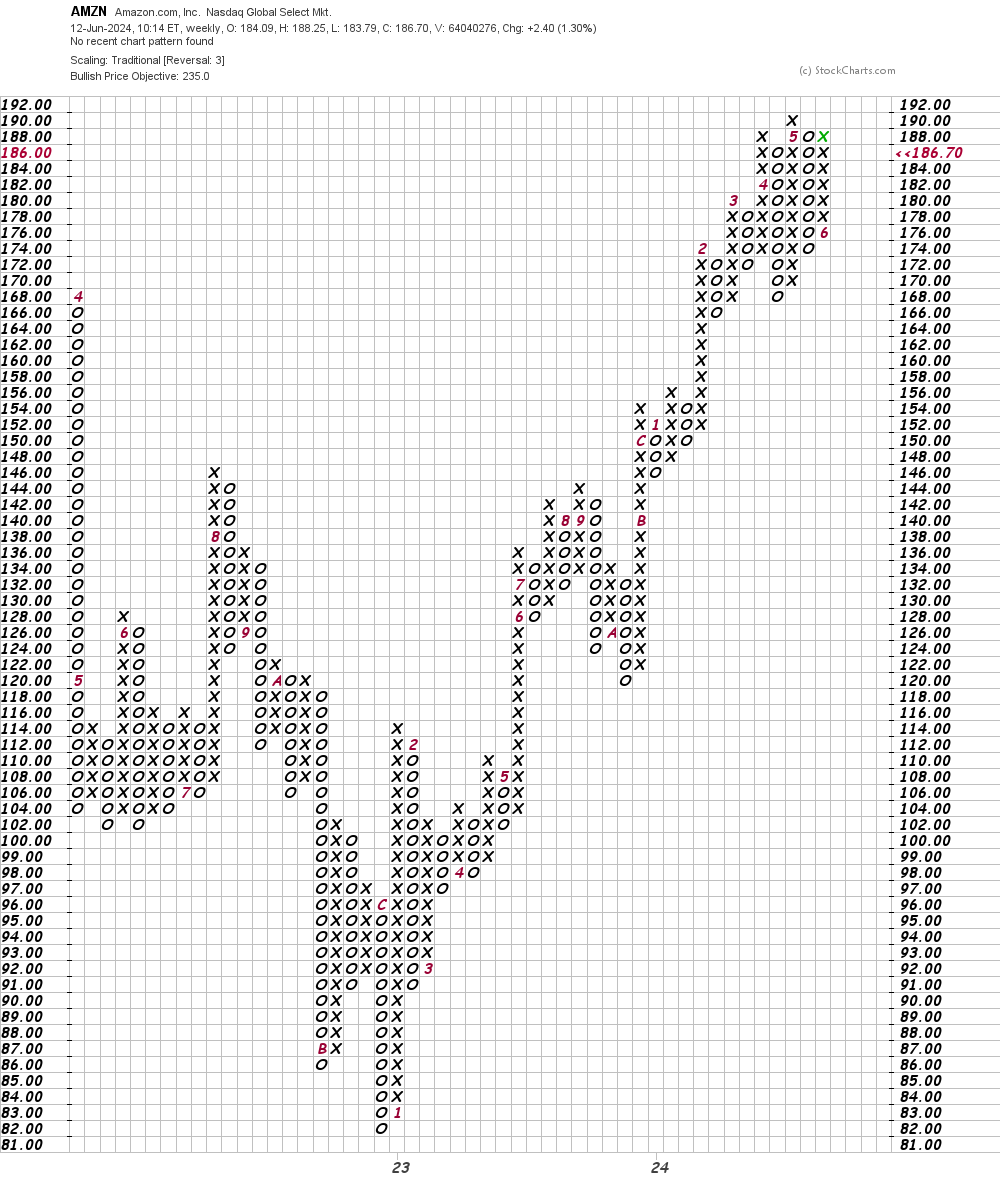
In this weekly Point and Figure chart of AMZN below, the chart is projecting a price target in the $235 area. A trade at $192 is needed to refresh the uptrend.
Bottom line strategy: Do you see the charts as bullish or bearish? This is the dilemma that's facing traders all the time. Let the price action guide your actions.
Employees of TheStreet are prohibited from trading individual securities.