Alibaba Rallies, So Why Am I Not Impressed?
The charts and indicators reveal a number of clues.
You've reached your free article limit
You've read 0 of 1 free Pro articles.
Alibaba Group BABA is rallying Monday after announcing plans to charge an infrastructure software service fee. This news seems to be viewed as positive by firms like Citigroup C.
Let's check the position of the charts and indicators for more clarity on the stock's prospects.
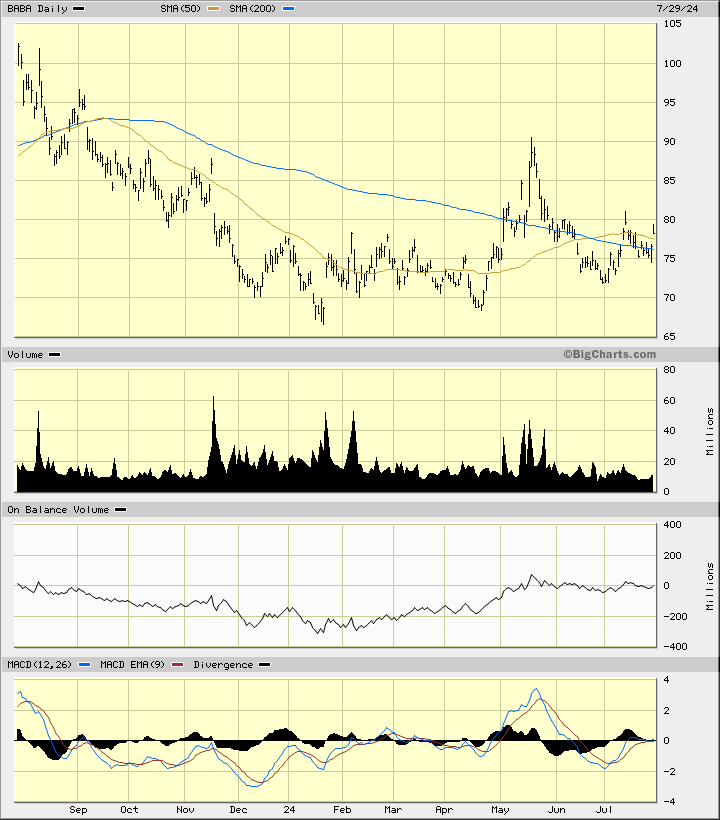
In the daily bar chart of BABA, below, I see a number of clues to consider. The shares showed me bottoming action from December through April and then rallied in May. BABA retraced much of the May gains and hit a low again in early July. BABA has firmed in July but has not made a new high for the move up. Prices are above the 50-day and 200-day moving average lines.
The On-Balance-Volume (OBV) line has drifted lower since the middle of May. The Moving Average Convergence Divergence (MACD) oscillator is hugging the zero line - we should see a fresh signal soon.
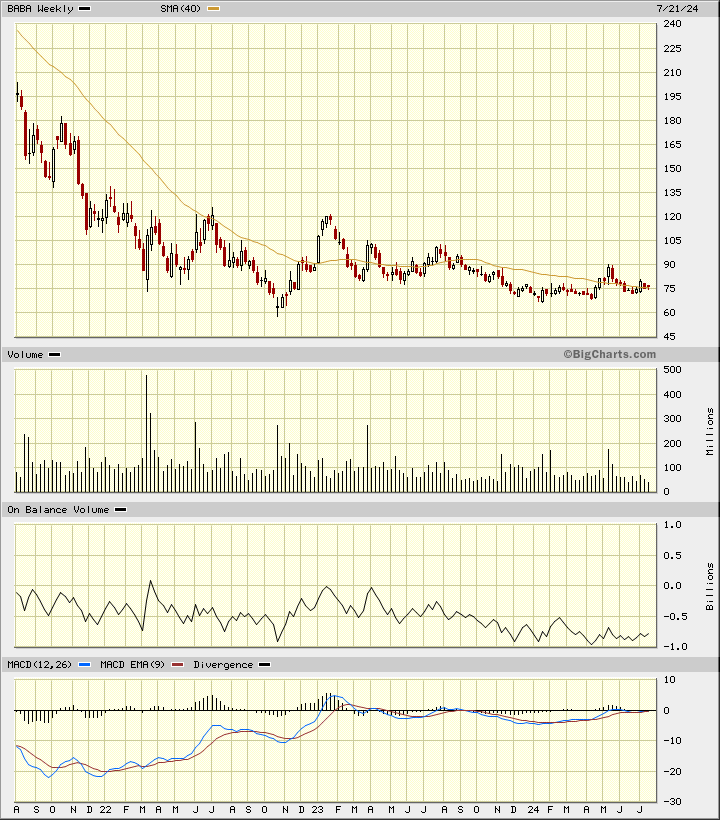
In the weekly Japanese candlestick chart of BABA, below, I find a picture that is not all that encouraging. The shares have declined from much higher levels in 2021 and 2022. BABA made a low in October 2022 but the subsequent gains were largely erased.
Trading volume has been dull and declining and the OBV line is depressed. The MACD oscillator is hugging the zero line.
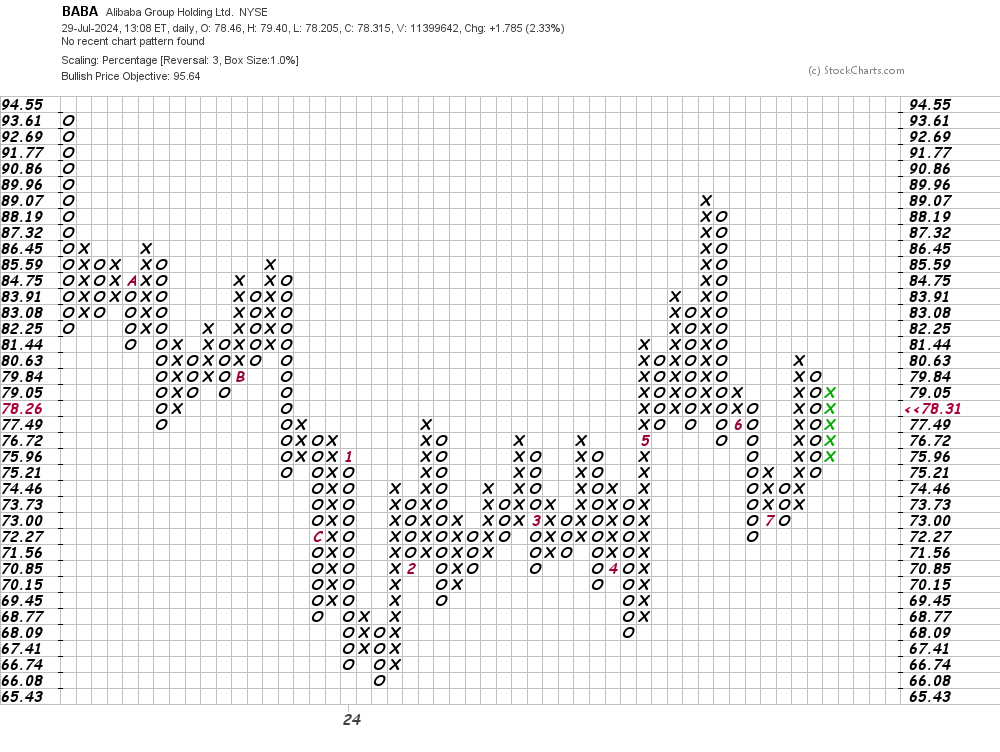
In this daily Point and Figure chart of BABA, below, I can see an upside price target in the $96 area but a trade at $81.44 or higher is needed to refresh the uptrend a bit.
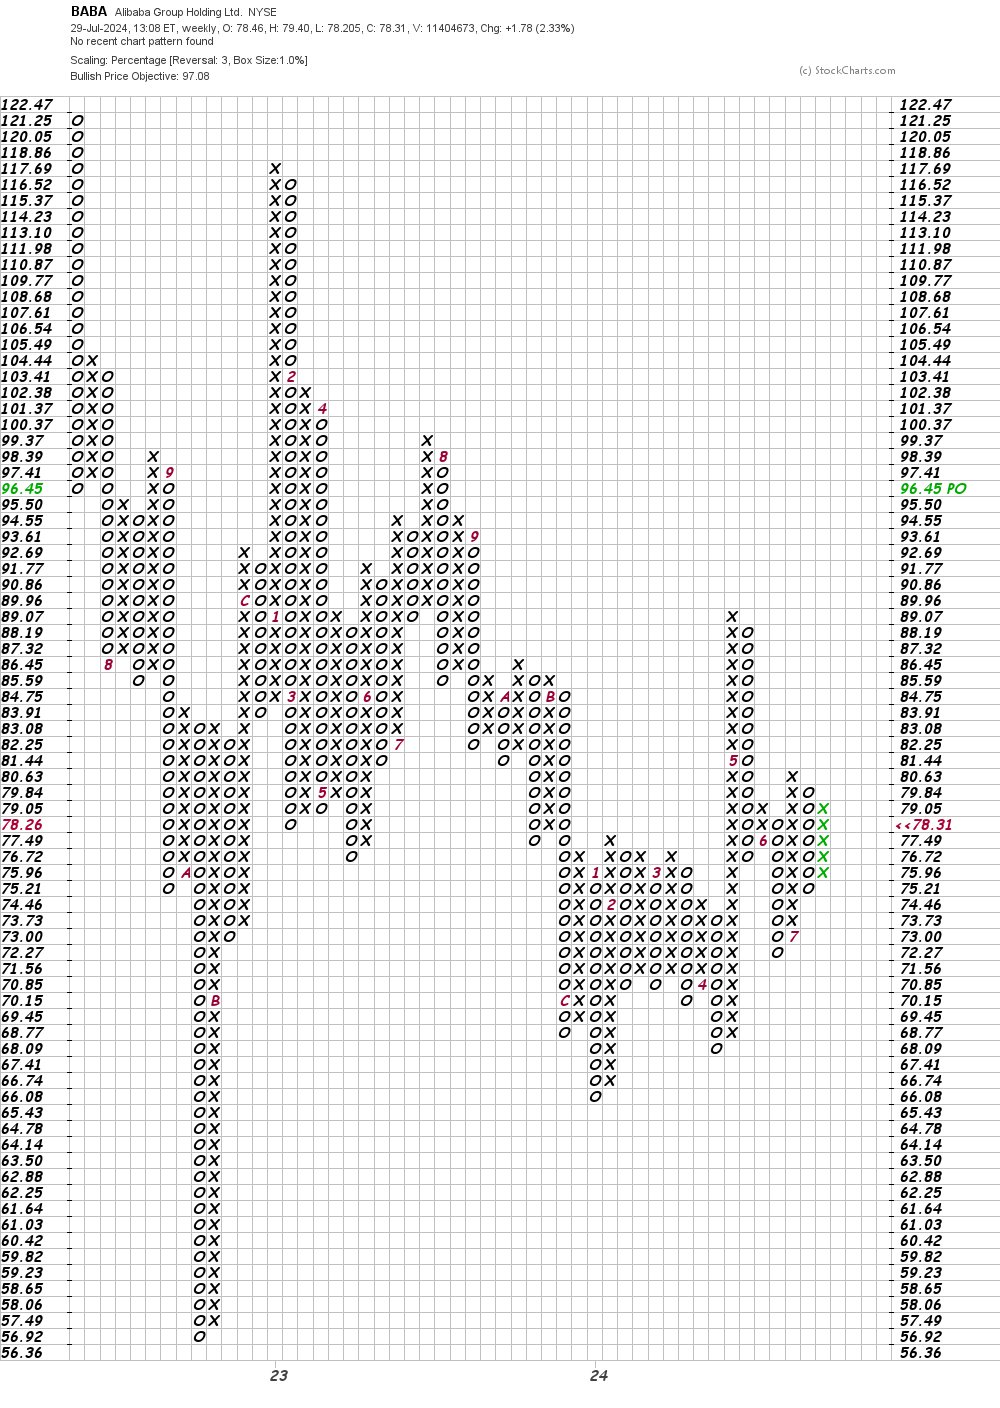
In this weekly Point and Figure chart of BABA, below, I can see a price target in the $97 area.
Bottom-line strategy: I last reviewed the charts of BABA on May 23 and I can't say that two months later that the technical outlook has materially improved.
Employees of TheStreet are prohibited from trading individual securities.