ADP Is Showing Cracks in the Foundation
Nothing good happens below the 200-day moving average line.
You've reached your free article limit
You've read 0 of 1 free Pro articles.
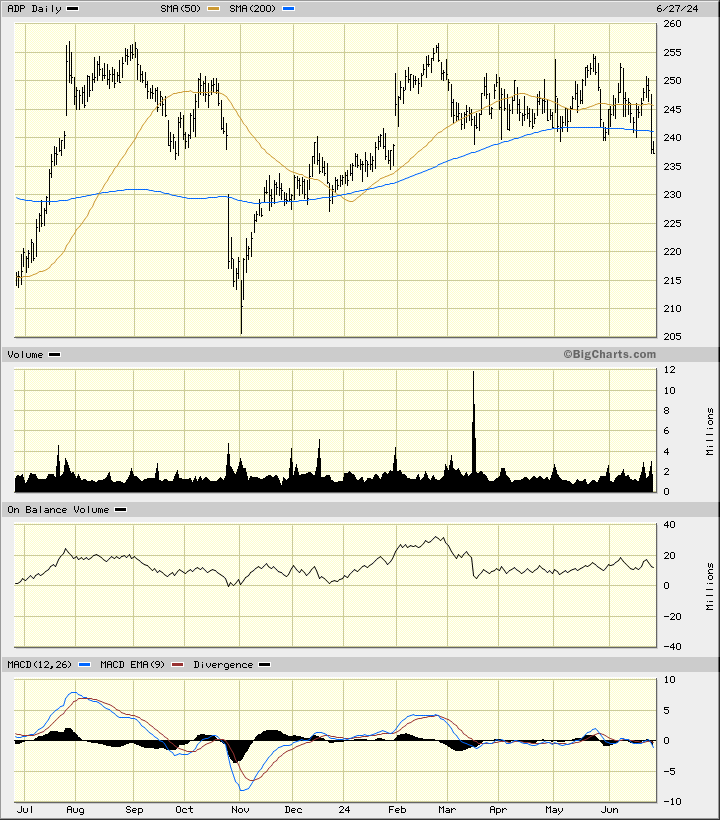
Shares of Automation Data Processing ADP have stalled in the past five months and weakened in recent days. They now trade below the declining 200-day moving average line.
Let's do a closer inspection of the charts and indicators and see what's going on.
In the daily bar chart of ADP, below, I can see that prices and indicators have weakened. In addition to trading below the 200-day moving average line the shares are at their lowest level since late February, which means that anyone who bought ADP since late February is "under water" with a loss.
The daily On-Balance-Volume (OBV) line is down from its February high. The Moving Average Convergence Divergence (MACD) oscillator is now slightly below the zero line.
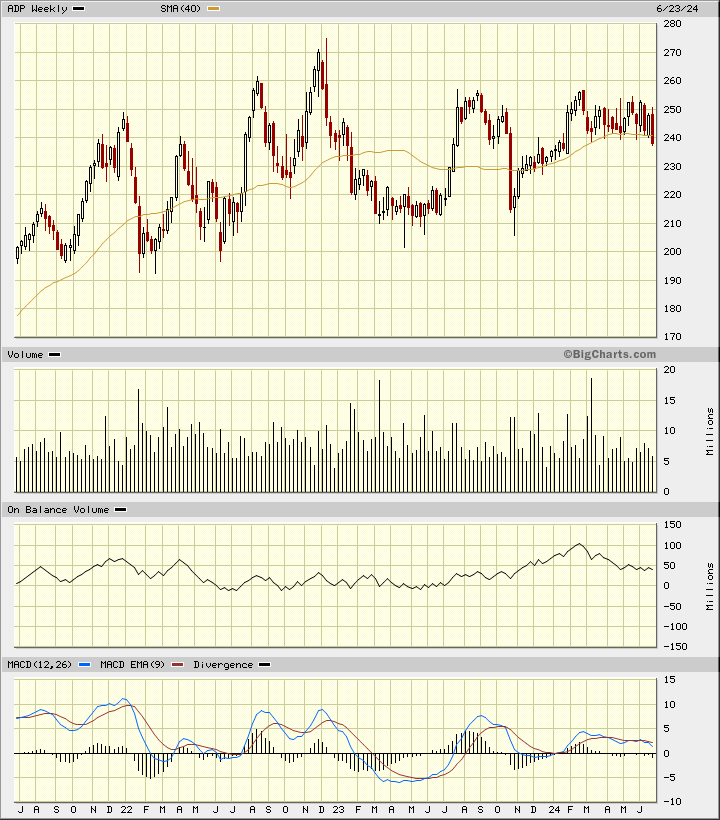
In the weekly Japanese candlestick chart of ADP, below, I can see that the shares made a high in late 2022. Prices declined in 2023 and have struggled to make upside progress in 2024. ADP is trading below the 40-week moving average line.
The weekly OBV line has declined since February and tells me that sellers of ADP are being more aggressive than buyers. The MACD oscillator has been correcting to the downside for the past few months.
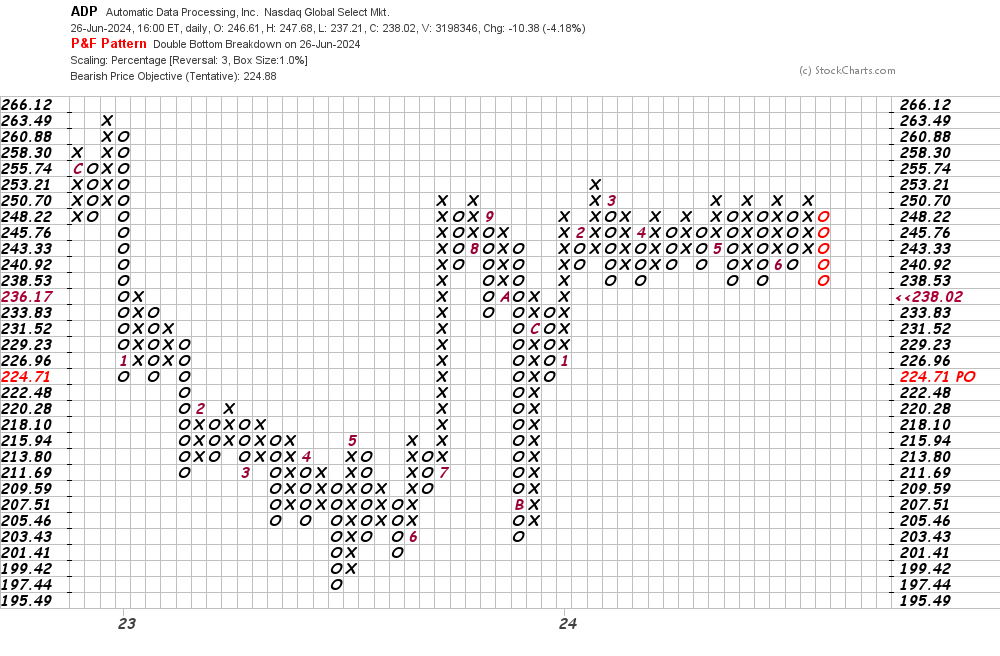
In this daily Point and Figure chart of ADP, below, I can see a downside price target in the $225-$224 area.
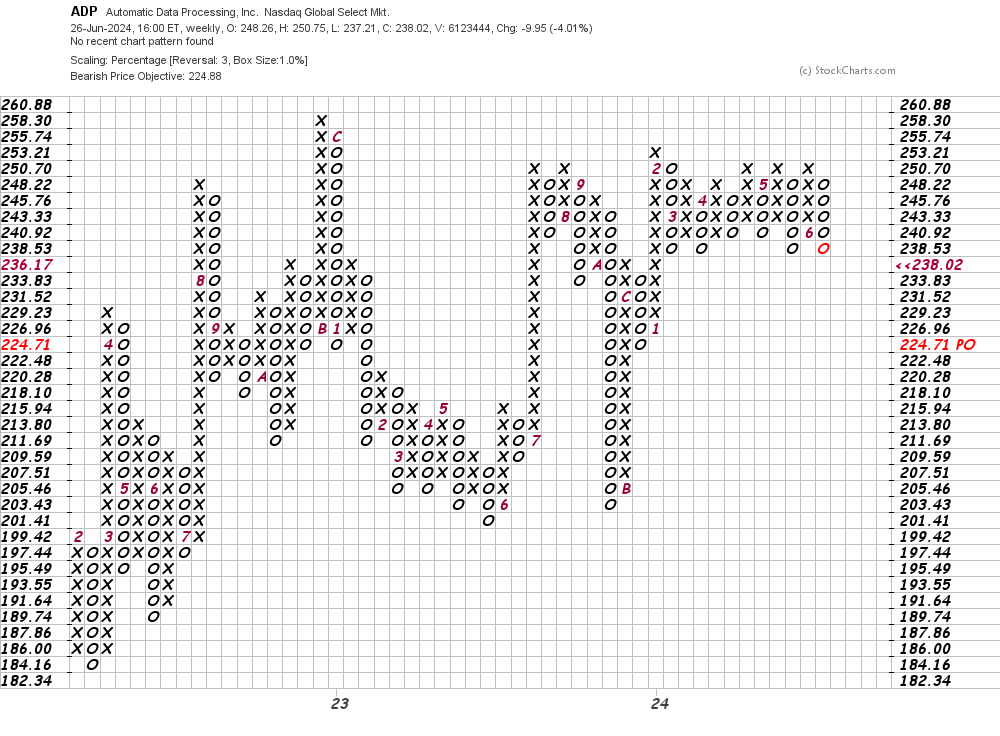
In this weekly Point and Figure chart of ADP, below, I can see the same price target as shown on the daily chart above.
Bottom-line strategy: A dear friend in the business recently reminded me of an old saying amongst traders: "Nothing good happens below the 200-day moving average line."
Buyers beware as ADP is trading below the 200-day average line.
Employees of TheStreet are prohibited from trading individual securities.