A Pop in PayPal Despite a Sloppy Market
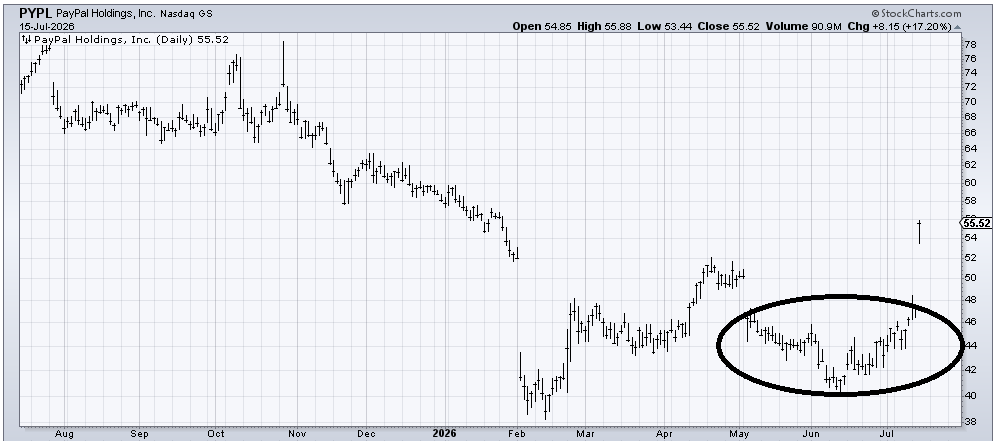
Since I recommended PayPal, it was up nicely, until today’s takeover talk, which sent shares up even more.
You've reached your free article limit
You've read 0 of 1 free Pro articles.

The Market
I have been talking about the chop lately. I have also been noting that if the SOX falls, it leaves room for the others to rally and vice versa. And yet there hasn’t been a great trend in the market since May.
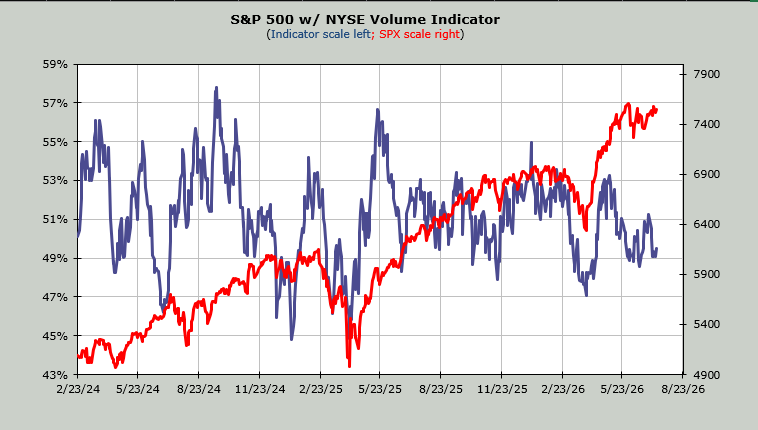
Then there are the two indicators that are pushing into oversold territory: the Volume Indicator (shown below), which sits at 49%. It gets oversold at 47%, so any whack should get it to an oversold condition.
The other indicator is the ‘what if’ for the McClellan Summation Index for Nasdaq. It still needs a net differential of just over +6 billion shares (up minus down volume) to halt the decline in the indicator. That makes it just about oversold (+7 billion would be a good oversold).
The issue is that I don’t have very many other indicators that say the same. I would note that the put/call ratio for the Russell 2000 has been pretty high the last three trading days: 4.09, 3.0, and 5.38 (I do not yet have the reading for Wednesday).
For all these reasons, I lean toward a rally in the others/RUT next week. I’d just love another down day or two first.
However, here’s the fly in the ointment, and it’s a sizeable one. The Investors’ Intelligence bulls are at 55.5%. Over 60%, and we have a giddy market. The bears are at 16.7%. There is no level there that gives us a warning on the bears, but the ratio of Bulls to Bears now sits at 3.3. A reading over 4.0 is bearish.
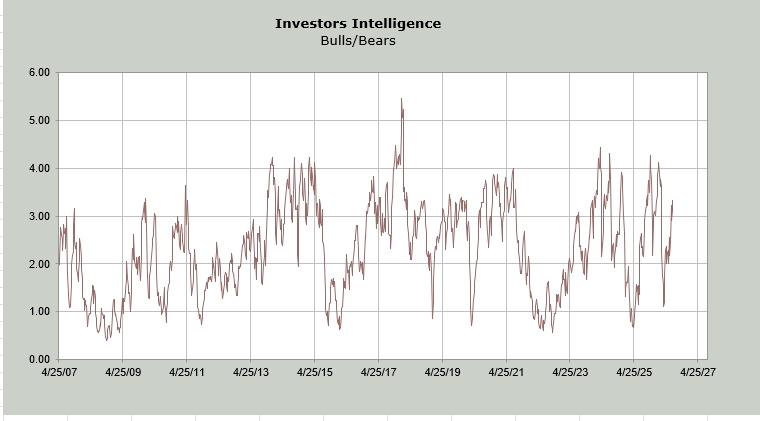
Let’s just imagine for a minute that the others rally well over the next week or so. And that Bullish number rises to 58%, and the bears fall to 15%. We’d be looking at the ratio of 3.9. In other words, even if we do get an oversold rally in the stocks that are down, the sentiment says that there is not a lot of room to run.
For now, the sloppiness continues, but gosh, I would love to see those down-and-outs get a lift in the next week.
New Ideas
We may as well begin with PayPal (PYPL), which I recommended just prior to my vacation around 42-43, and then two days ago decided we should do a bit of profit-taking when it got to 48. I was still looking for a gap fill to that 49-50 area, and now there is a bid for the company, and instead of filling the gap, it gaps up, leaving that whole area at the lows as an island!
There may turn out to be a bidding war here, but I would be using a trailing stop on this or even (gasp!) taking something off the table.
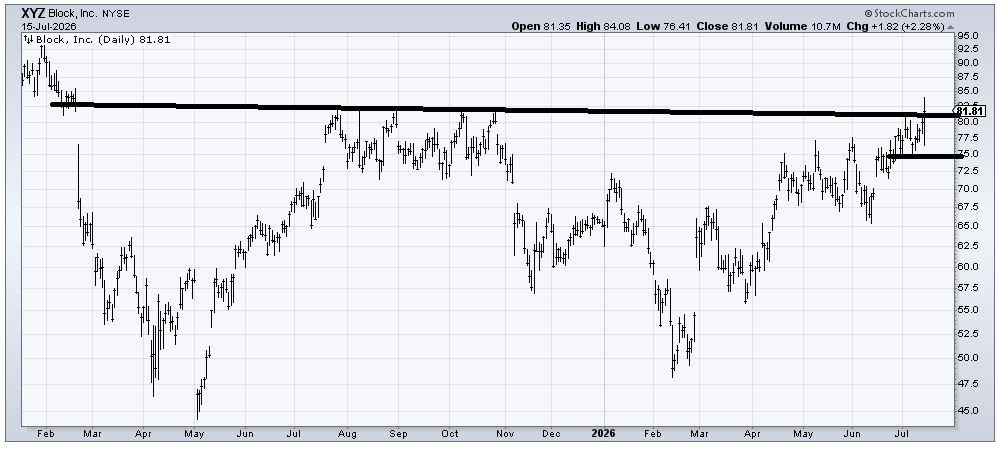
Block (XYZ) is a stock I have liked for a while, and it has been a grind. It is not oversold, but it does sit right at the breakout. I’m going to use a stop under 75 now.
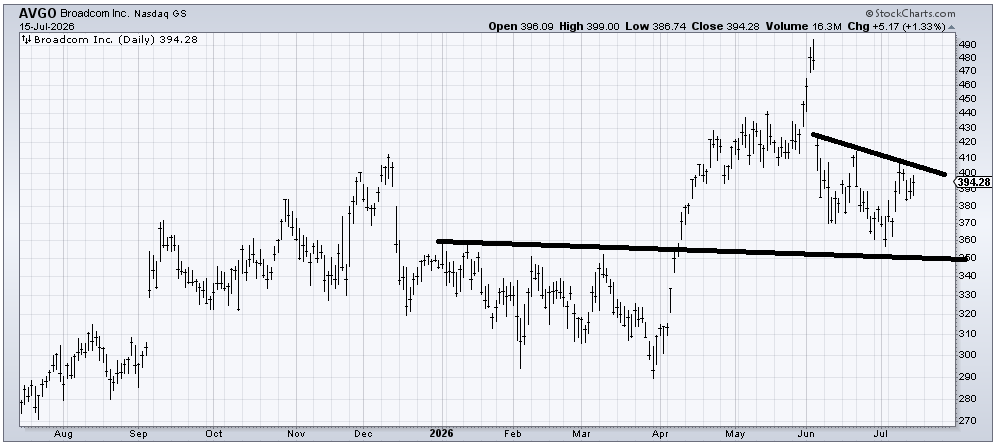
Lastly, keep your eyes on Broadcom (AVGO) because it did bounce well off support, but now if it can get up and over 410, that would be another plus.
Today’s Indicator
The Volume Indicator is discussed above.
Q&A/Reader’s Feedback
Helene welcomes your questions about Top Stocks and her charting strategy and techniques. Please send an email directly to Helene with your questions. However, please remember that TheStreet.com Top Stocks is not intended to provide personalized investment advice. Email Helene here.
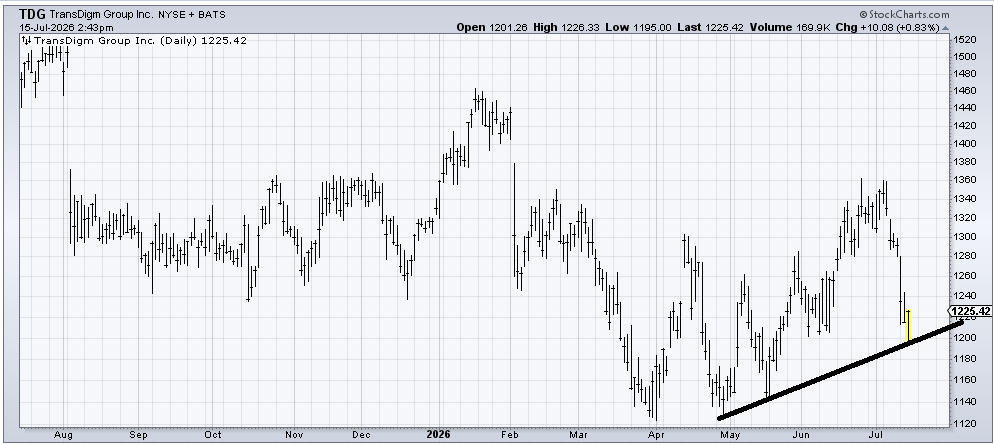
TransDigm (TDG) is bouncing right off an uptrend line. I think it can go to 1280-ish (and then I’d have to take another look) because it has been so disappointing for so long. But if it cannot get up and over 1240, I would fret that this decline is not yet done.
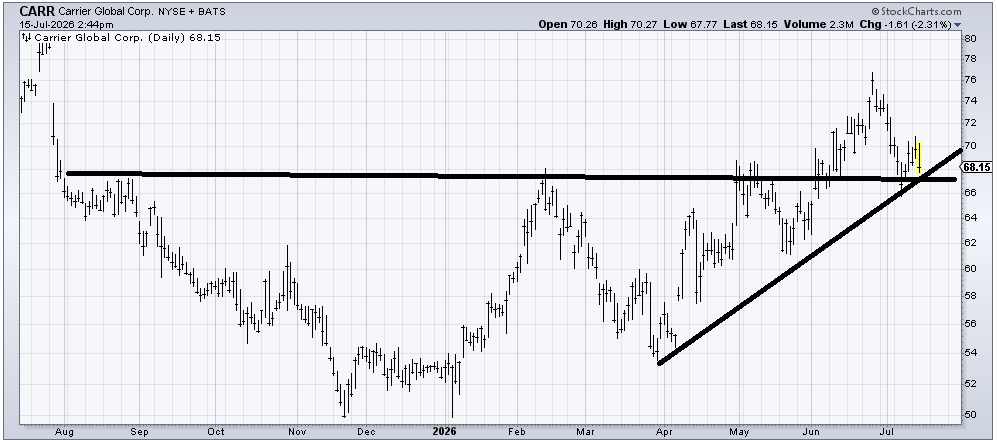
Carrier Global (CARR), which has sucked me in and subsequently spit me out so many times in the last year had better hold 66 or this will once again look like a failure.
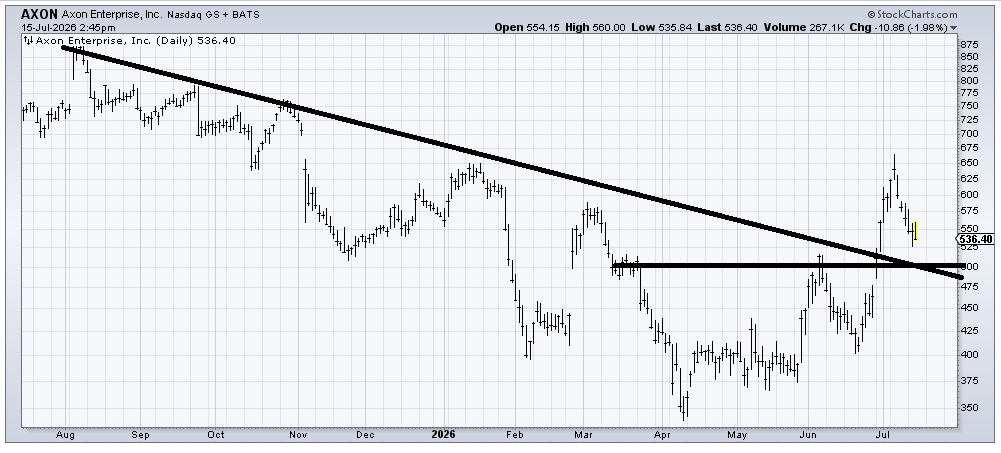
I would very much like to see this current pullback in Axon (AXON) come down to 500 and show signs of holding. And if it can do it over the next 4-8 weeks, that would be even better. You see if it can do it gradually, then we will begin to drop the left side of the chart (last August’s spike high), which would make the chart look flatter and more interesting on the long side.
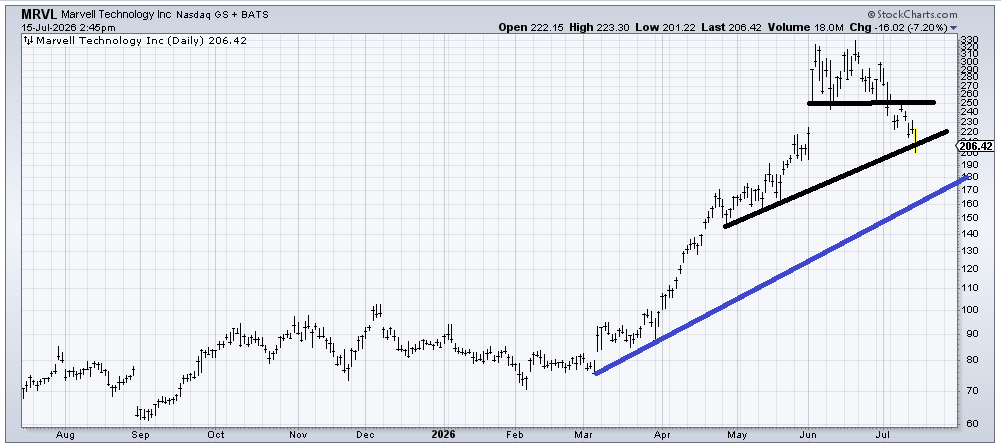
Marvel (MRVL) is getting a little bit oversold down here (it is down 30%+ in a month), but I would love to see it bounce and then come down toward the blue line. I figure by then there will surely be a story about why we no longer like the semis.
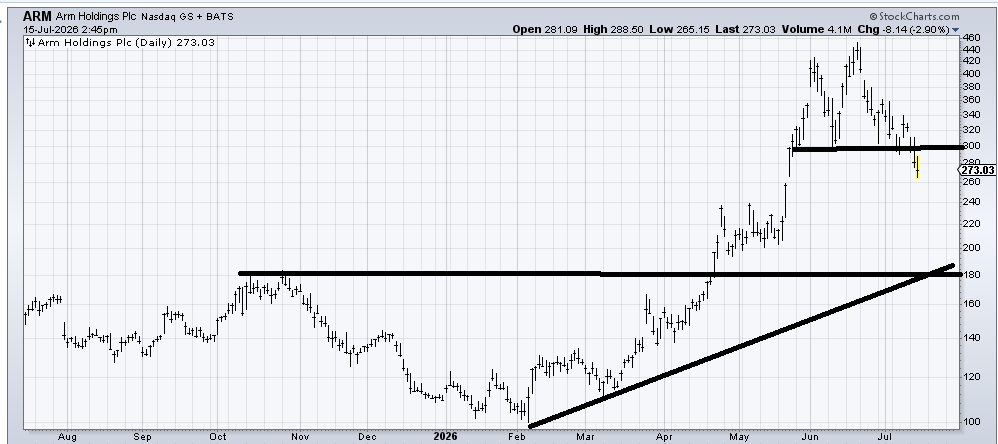
Arm (ARM) has broken. We had a great trade in it last spring, but now it has broken. There is a tiny gap to fill around 260, and it is getting oversold (short term), so unless that bounce can get back up and over 300, I’d look for the stock to work its way down to support (wide range of 180-220).