A Lower High for New Highs?
Today saw a rise in new highs on the NYSE, but there were still about 20% fewer than just two weeks ago.
You've reached your free article limit
You've read 0 of 1 free Pro articles.

The Market
Note: it’s time for me to have the left eye done! The doctor says the right eye was a success, so with any luck, I’ll be good as new this coming weekend. Right now, I’m a bit lopsided. Thanks, everyone, for all the well-wishes. The next issue of Top Stocks will be on Sunday, May 31st.
I would say that the others got to play today, but it was selective among them. The banks lagged. The Utes, which I like but expect to be bumpy, ran smack into resistance and closed near the low. The Transports, however, keep on trucking.
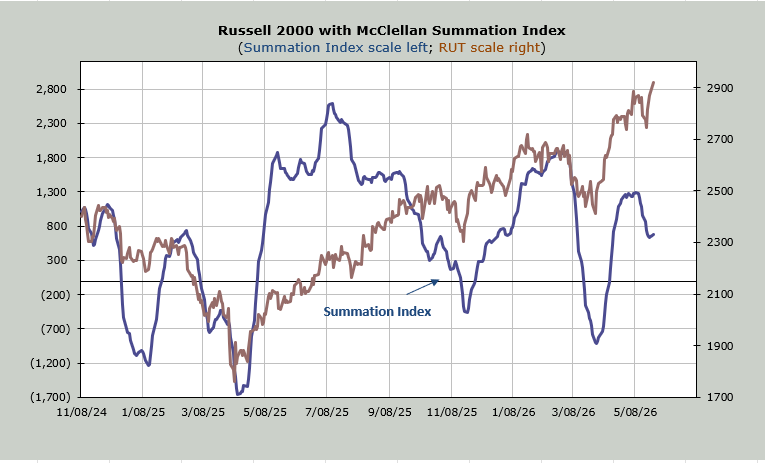
Statistically, the McClellan Summation Index stopped going down. It will need another decent up day to turn it back up. It will need net breadth to be +600 on the NYSE. Typically, I would say that is quite doable, but last week, two of the up days couldn’t even log that type of number. The chart is shown below.
The new highs increased but remain far below the peak reading. Heck, two weeks ago the NYSE saw just over 200 stocks making new highs, and today we saw 163. Notice I am not even pointing out that before the war broke out, the NYSE had over 400 stocks making new highs.
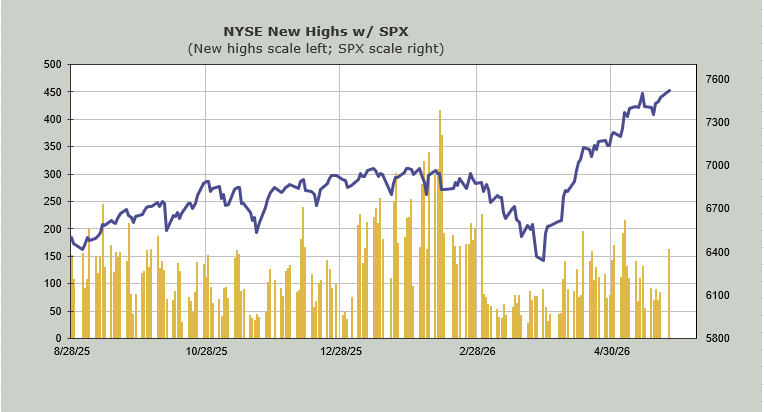
Nasdaq, however, is getting back to its lofty level of new highs, with 550 new highs (the peak reading was 570).
But did we get sentiment to push into giddy? Not quite. The DSI for Nasdaq got to 80. Recall, just before that pullback two weeks ago, it had gotten to 85.
But the VIX stayed green most of the day. I am still waiting for a bout of volatility, and thus far, the market laughs at me. I maintain that the market is quite complacent.
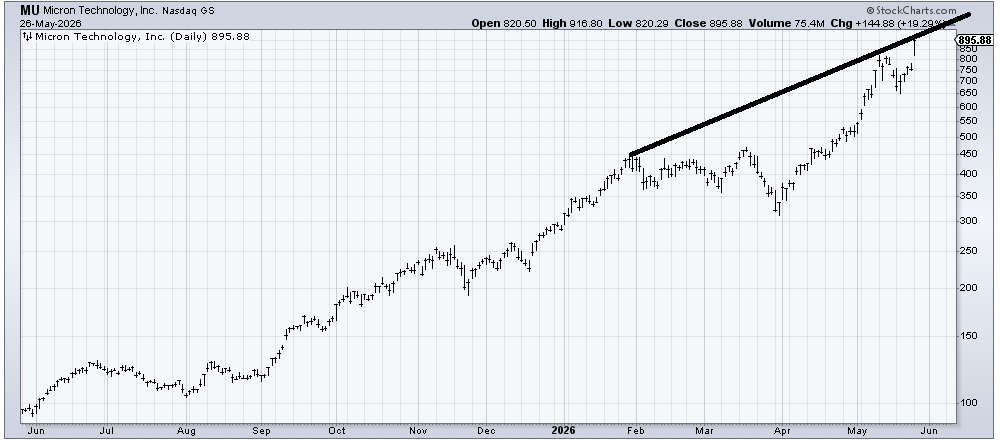
And what of the moves in the semis? Well, I could point out that it seems Intel (INTC) has handed the baton to Micron (MU), but that’s not helpful. I can also tell you the chart of Micron still hasn’t done anything wrong. To do something wrong, it would need to sell off and rally back to a lower high. It hasn’t done that yet.
To do something wrong, it would need to open on a gap under 800 and leave today’s action as an island. Is it at resistance? It is at light resistance. Do I think tripling a price target is ridiculous? Of course I do. But I watch the charts.
New Ideas
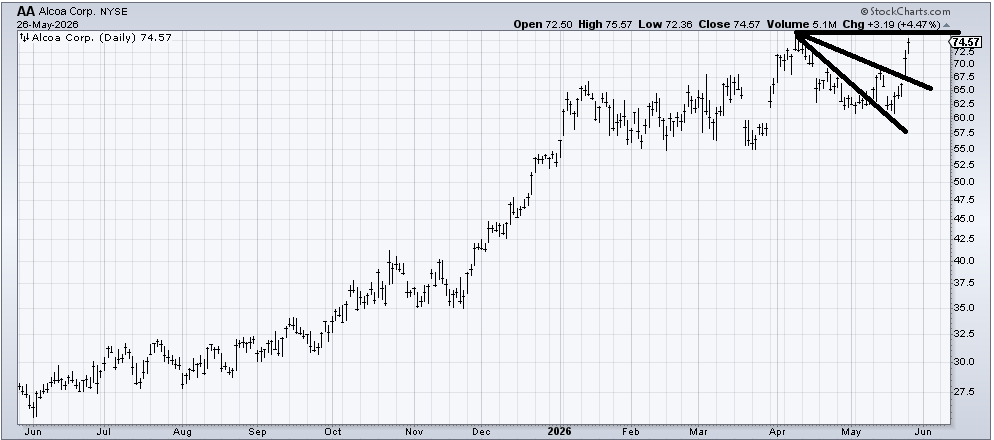
I realize it’s more fun to trade Micron, but last week (and the week before that!) I recommended Alcoa (AA), which has had a tidy run of just over 20% in a week. It has some resistance in this 74-76 area. As a trader, I’d probably sell a little into resistance, but overall, I remain positive on the chart.
Today’s Indicator
The McClellan Summation Index is discussed in full above.
Q&A/Reader’s Feedback
Helene welcomes your questions about Top Stocks and her charting strategy and techniques. Please send an email directly to Helene with your questions. However, please remember that TheStreet.com Top Stocks is not intended to provide personalized investment advice. Email Helene here.
Agnico Eagle Mines (AEM) is trying to hold the blue support lines. But then you’d have to ignore the breakdown from the triangle. I think the best it can do right now is fill that gap at 190. At some point, I expect I will like gold and gold stocks again, but I haven’t liked them for months, and I just see lower highs for the time being.

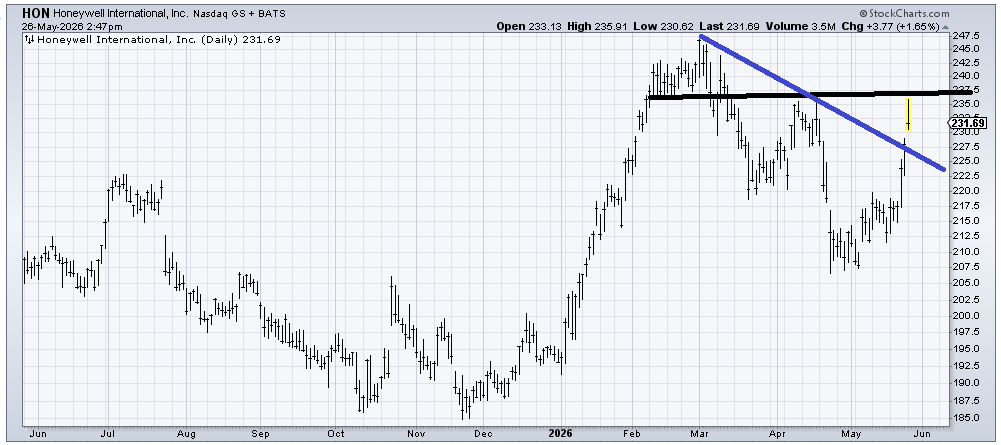
Honeywell (HON) got stopped right at resistance (black line). I would like it to gradually make its way to the blue line to retest and form a possible head and shoulders bottom. Can it accommodate me?!
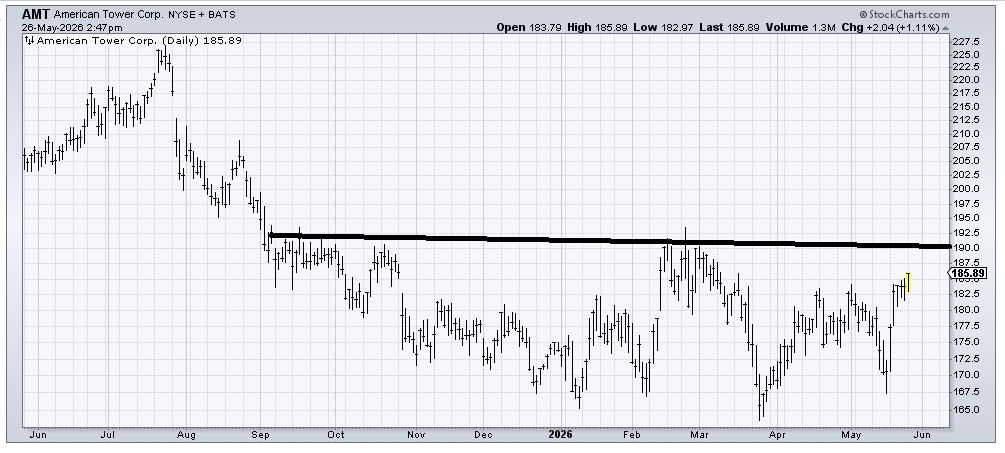
We found a stock working on a base! American Tower (AMT) still has some work to do to build the base, and it’s a little bit short-term overbought. However, I’d buy dips with a lot of patience because if it can ever get over 190, that would be a breakout.
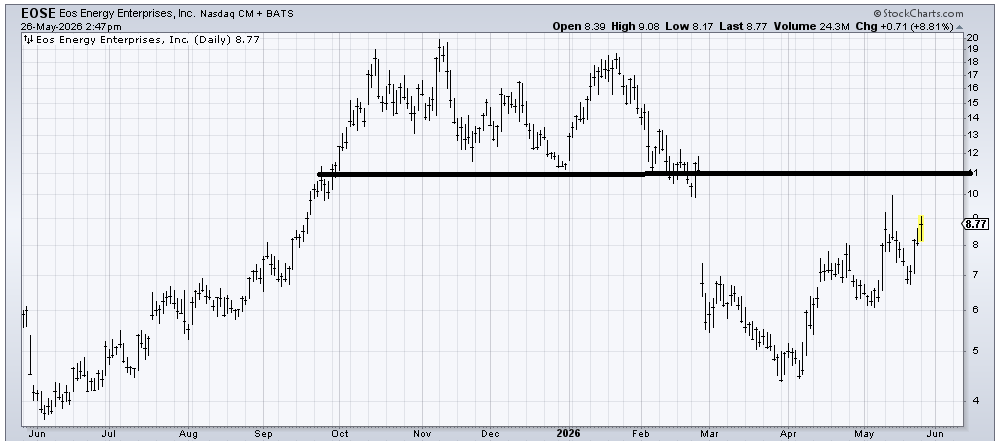
Eos Energy (EOSE) should fill that gap in the 10-11 area, but that seems like the best it can do for the time being. There is a lot of resistance overhead starting at 11-ish.
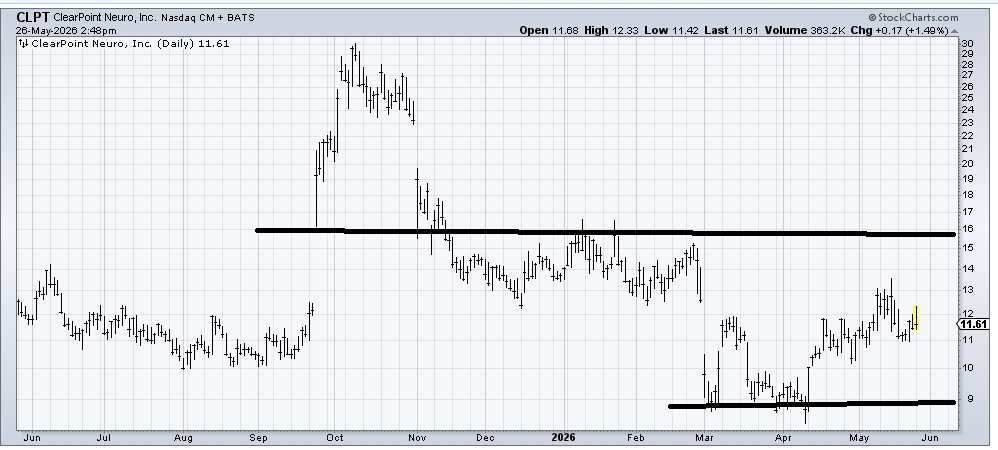
ClearPoint Neuro (CLPT) rallied to fill the gap down from late February and now threatens to head back down again. If the chart is going to interest me, I’d like to see one of two scenarios take shape. First: a rally to 15-16 that then pulls back to 13-ish. Or a push back down into the 9-10 area that holds and forms a small base, such as we saw develop last summer between 10 and 12. So the chart isn’t bad, it just feels like it needs more time to develop.
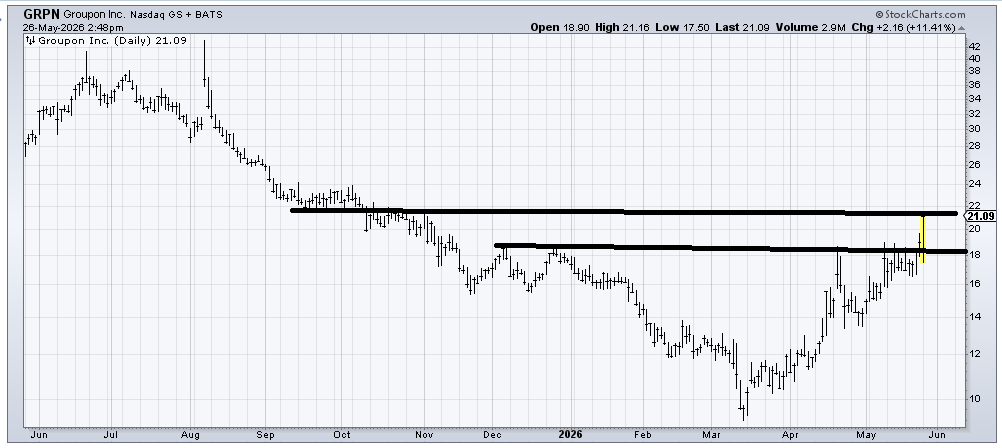
I was surprised to discover that Groupon (GRPN) is still a public company, and my first thought was, meme stock. My second thought was also meme stock! If I didn’t know what the stock is, I would say proceed with caution and use a stop under 16-17.
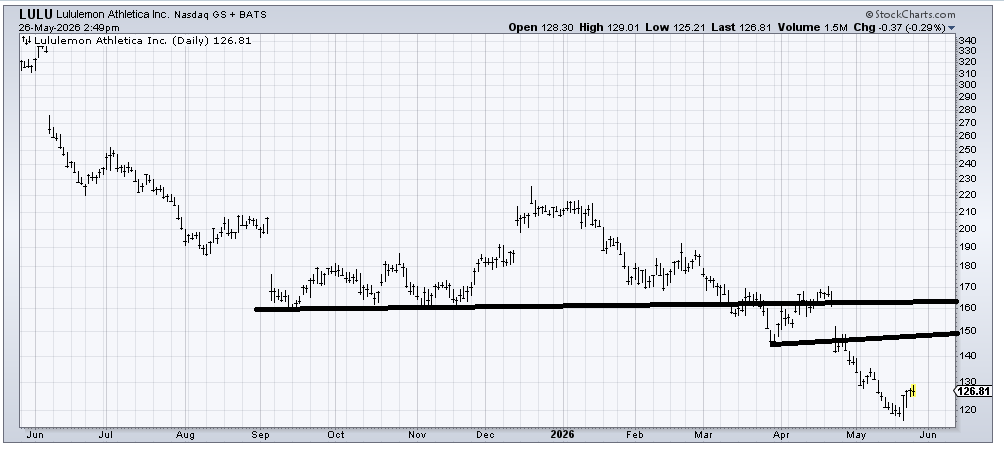
Lululemon (LULU) is a stock I tried to bottom fish in a few months ago and got burned. It does have a measured target in this 110-120 area, and earnings are next week. I suppose it can rally to resistance at 150. The stock is oversold, so it ought to rally, but the only thing that would turn this chart bullish (to me) is a gap up over 170.