10 Tech Sector Stock Charts to Watch
We're charting Rocket Labs, AMD, Meta, Microsoft, Leidos, software, semiconductors and more!
You've reached your free article limit
You've read 0 of 1 free Pro articles.
In yesterday’s article, the charts demonstrated that the pendulum is swinging away from defensive stocks and back toward technology. Today, we’ll look at individual sectors, with added emphasis on tech stocks.
Software Sector
Software is one of the strongest sectors within tech. The sector, represented here by the S&P Software and Services SPDR (XSW, left chart), closed at a three-year high on Tuesday.
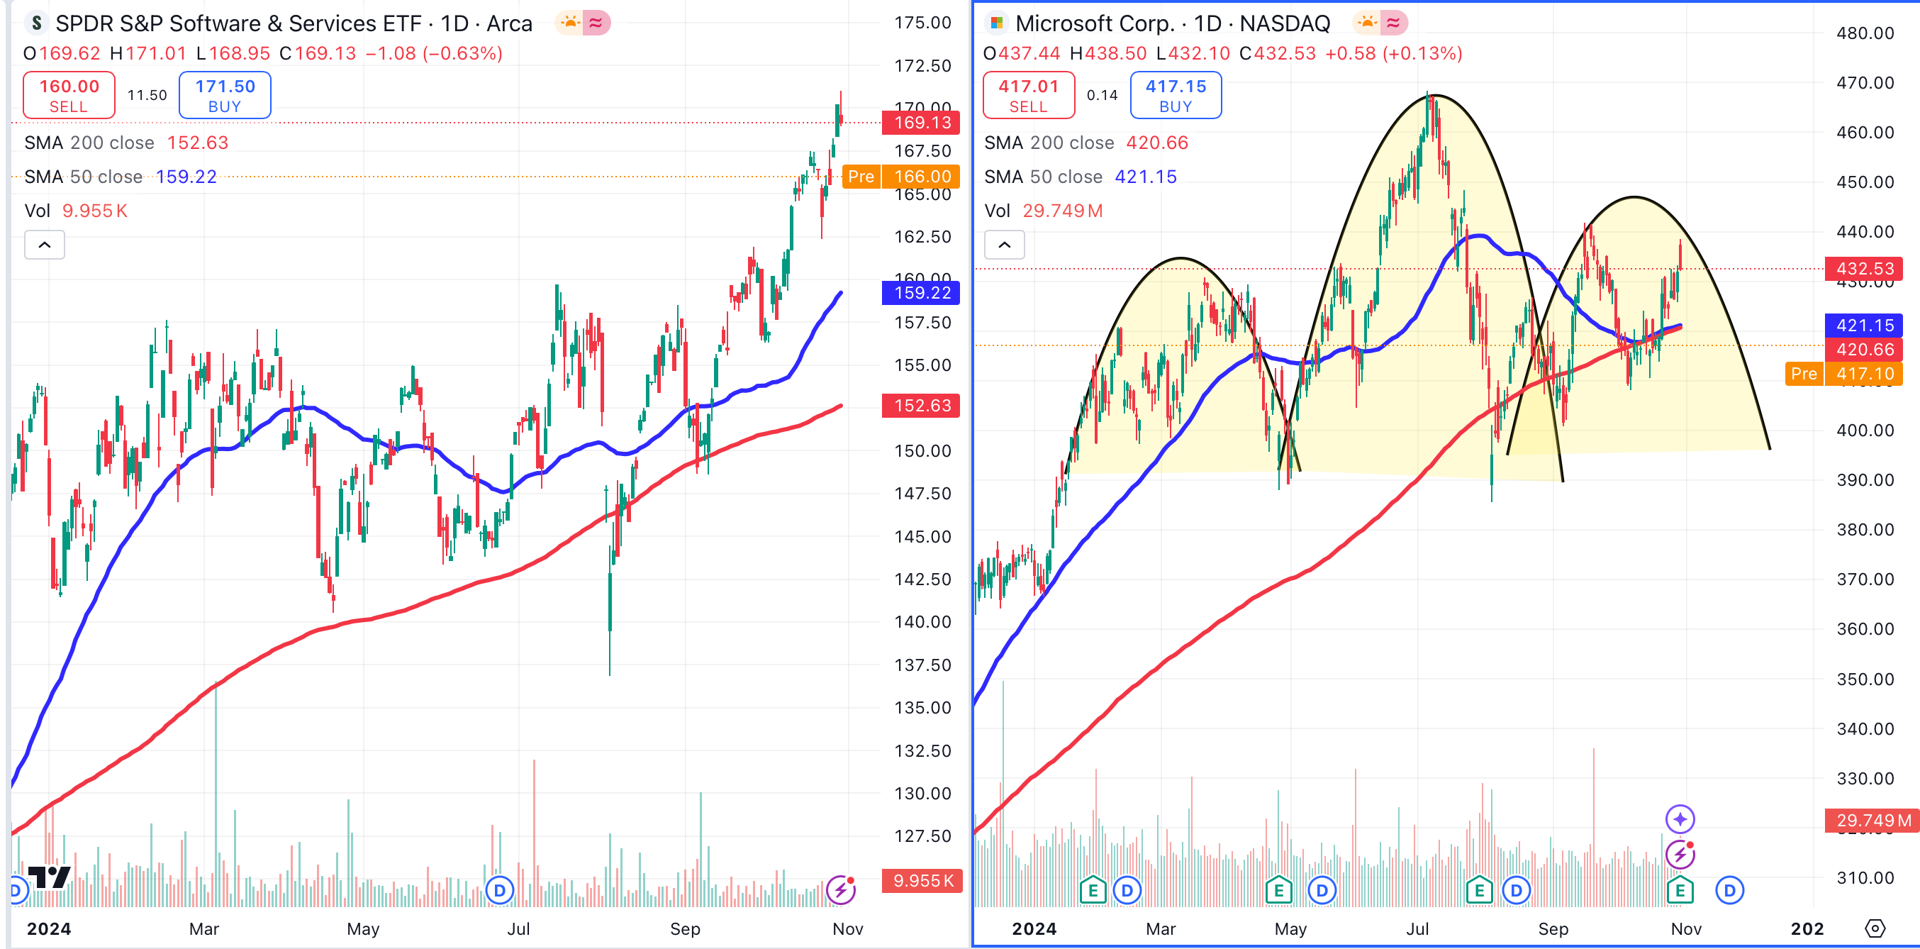
Despite this relative strength, this sector’s good fortune isn’t equally distributed among its biggest names. While stocks such as Oracle ORCL continue to shine, it’s impossible to ignore recent underperformance by sector leader Microsoft MSFT.
Microsoft (right chart) is trading below its 50-day (blue) and 200-day (red) moving averages after beating earnings and revenue estimates after Wednesday’s close. This stock has been forming a potential head and shoulders (shaded yellow) since the start of the year. Analysts were disappointed with Microsoft’s revenue projections for AI and cloud services.
Communications Sector
The communications sector, represented here by the Communications Services SPDR XLC, closed at an all-time high on Wednesday. XLC (left chart) gapped higher at Wednesday’s open, then proceeded to sell off and close near its lows. Don’t be surprised if that gap fills before XLC resumes its relentless bullish trend.
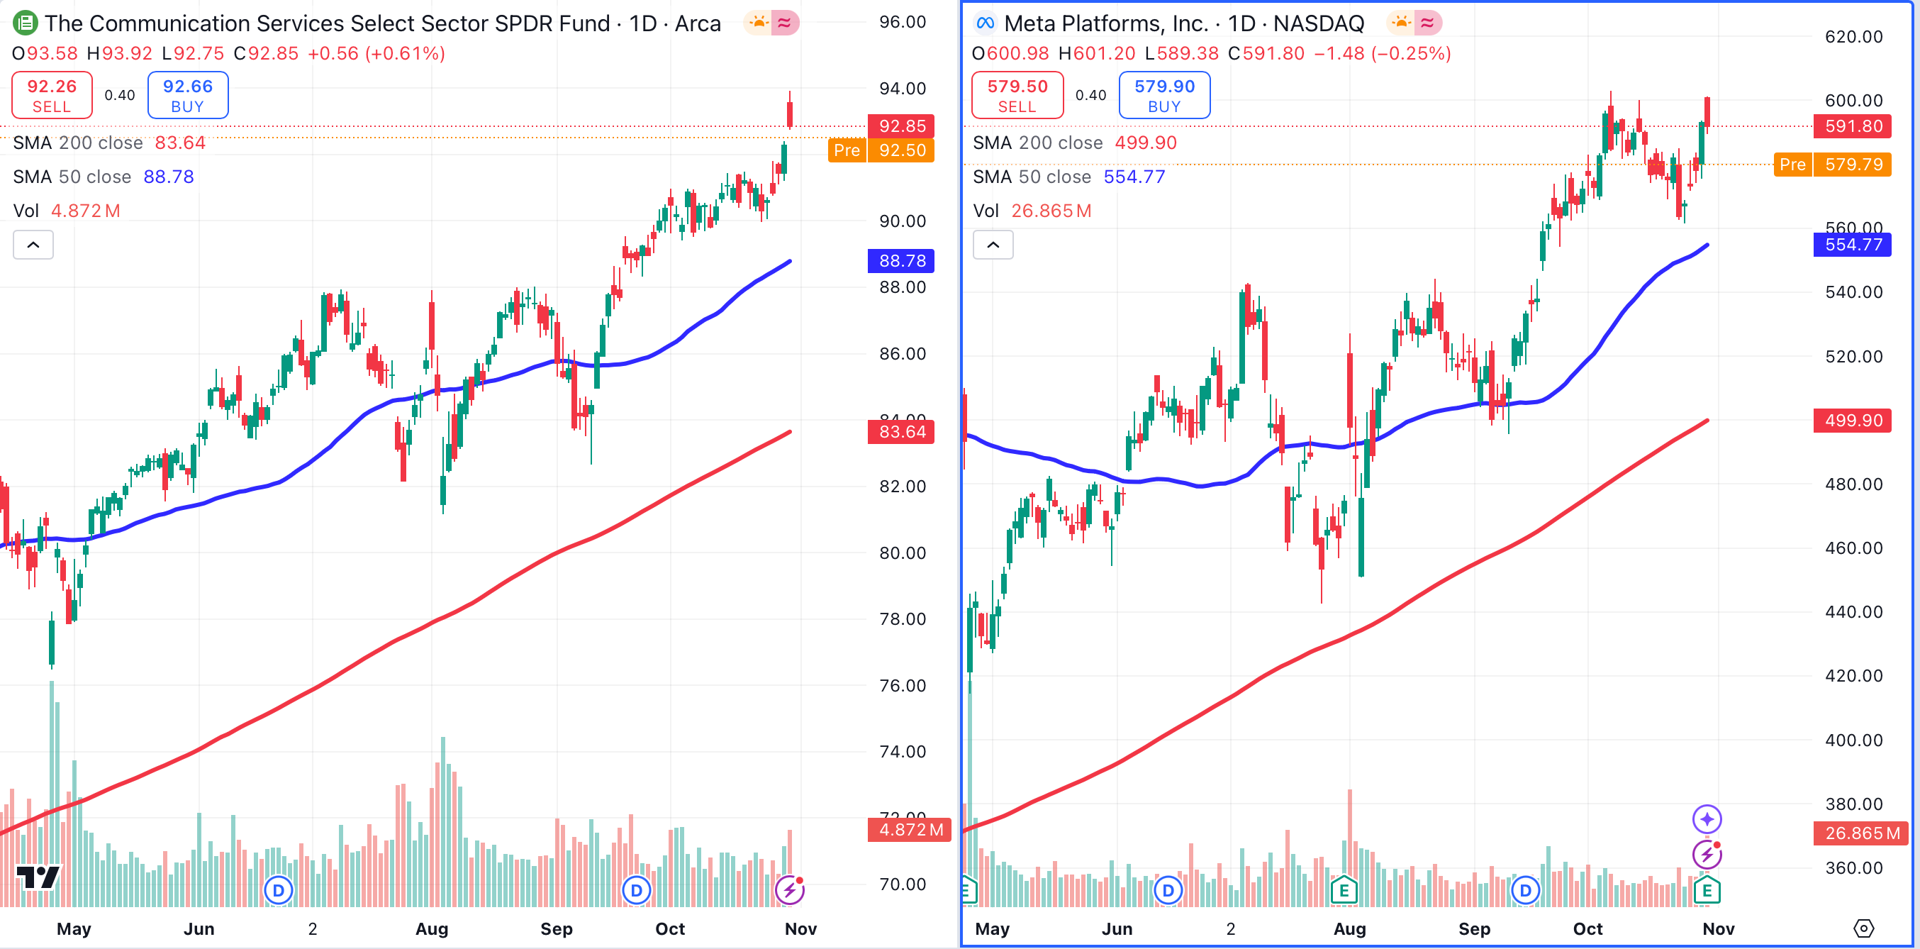
The ETF lists Meta Platforms META as its top holding. Meta (right chart) reported after Wednesday's close, and earnings and revenue were above estimates. However, the company expects “significant capital expenditures growth” in 2025, according to CFO Susan Li, and this news caused the stock to retreat prior to Thursday's open. Despite this, Meta’s bullish trend remains intact.
Semiconductor Sector
Despite strength in the Nasdaq and in the tech sectors listed above, semiconductors are struggling. The sector, represented below by the Philadelphia Semiconductor Index (SOX, left chart) has formed a symmetrical triangle pattern (black dotted lines). This pattern consists of higher lows and lower highs, and has no directional bias.
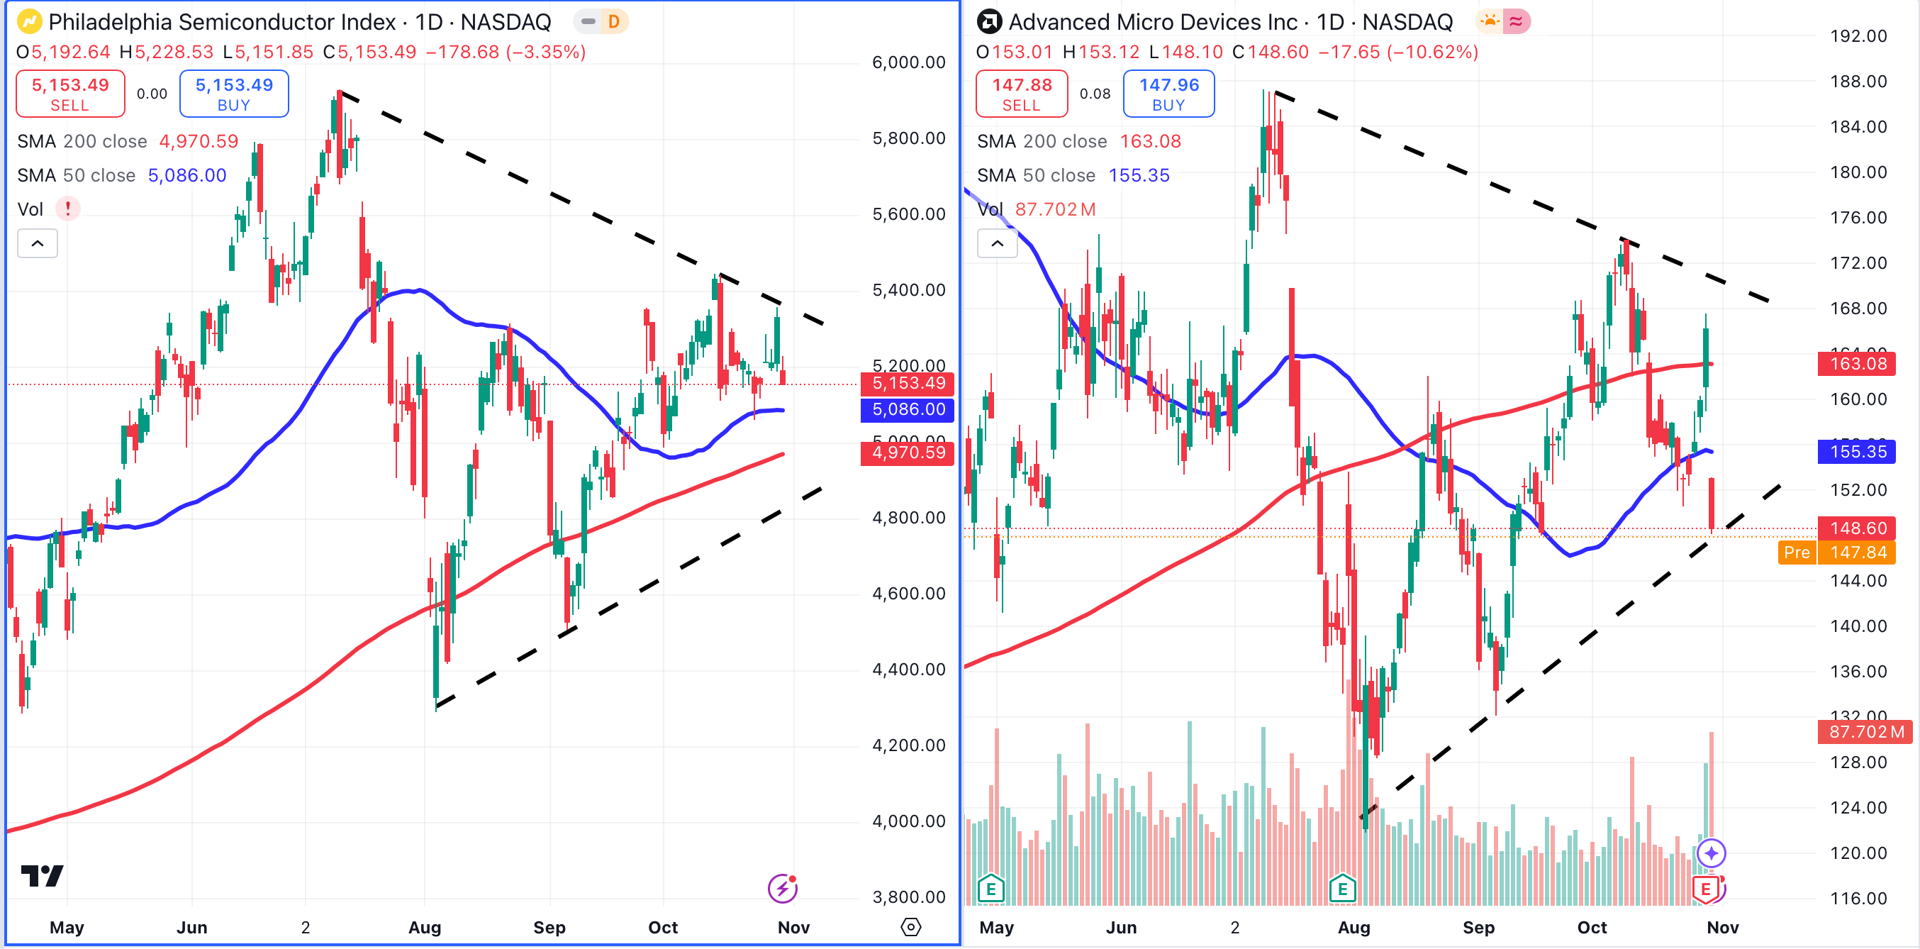
That same pattern is visible on the chart of former market darling Advanced Micro Devices (AMD, right chart). That stock dropped by 10.5% on Wednesday after the chip maker came up short on earnings. Analysts were disappointed in the sales growth rate of AMD’s AI chips, an area currently dominated by Nvidia.
Space Exploration Sector
Most folks are unaware that an investment in the space exploration sector is possible. Because of this, the ETFs designed for this purpose trade on relatively low volume.
The ARK Space Exploration and Innovation ETF (ARKX, left chart) is focused on this sector, ARKX looks due for a minor pullback after forming a small head and shoulders pattern (shaded yellow) over the past month.
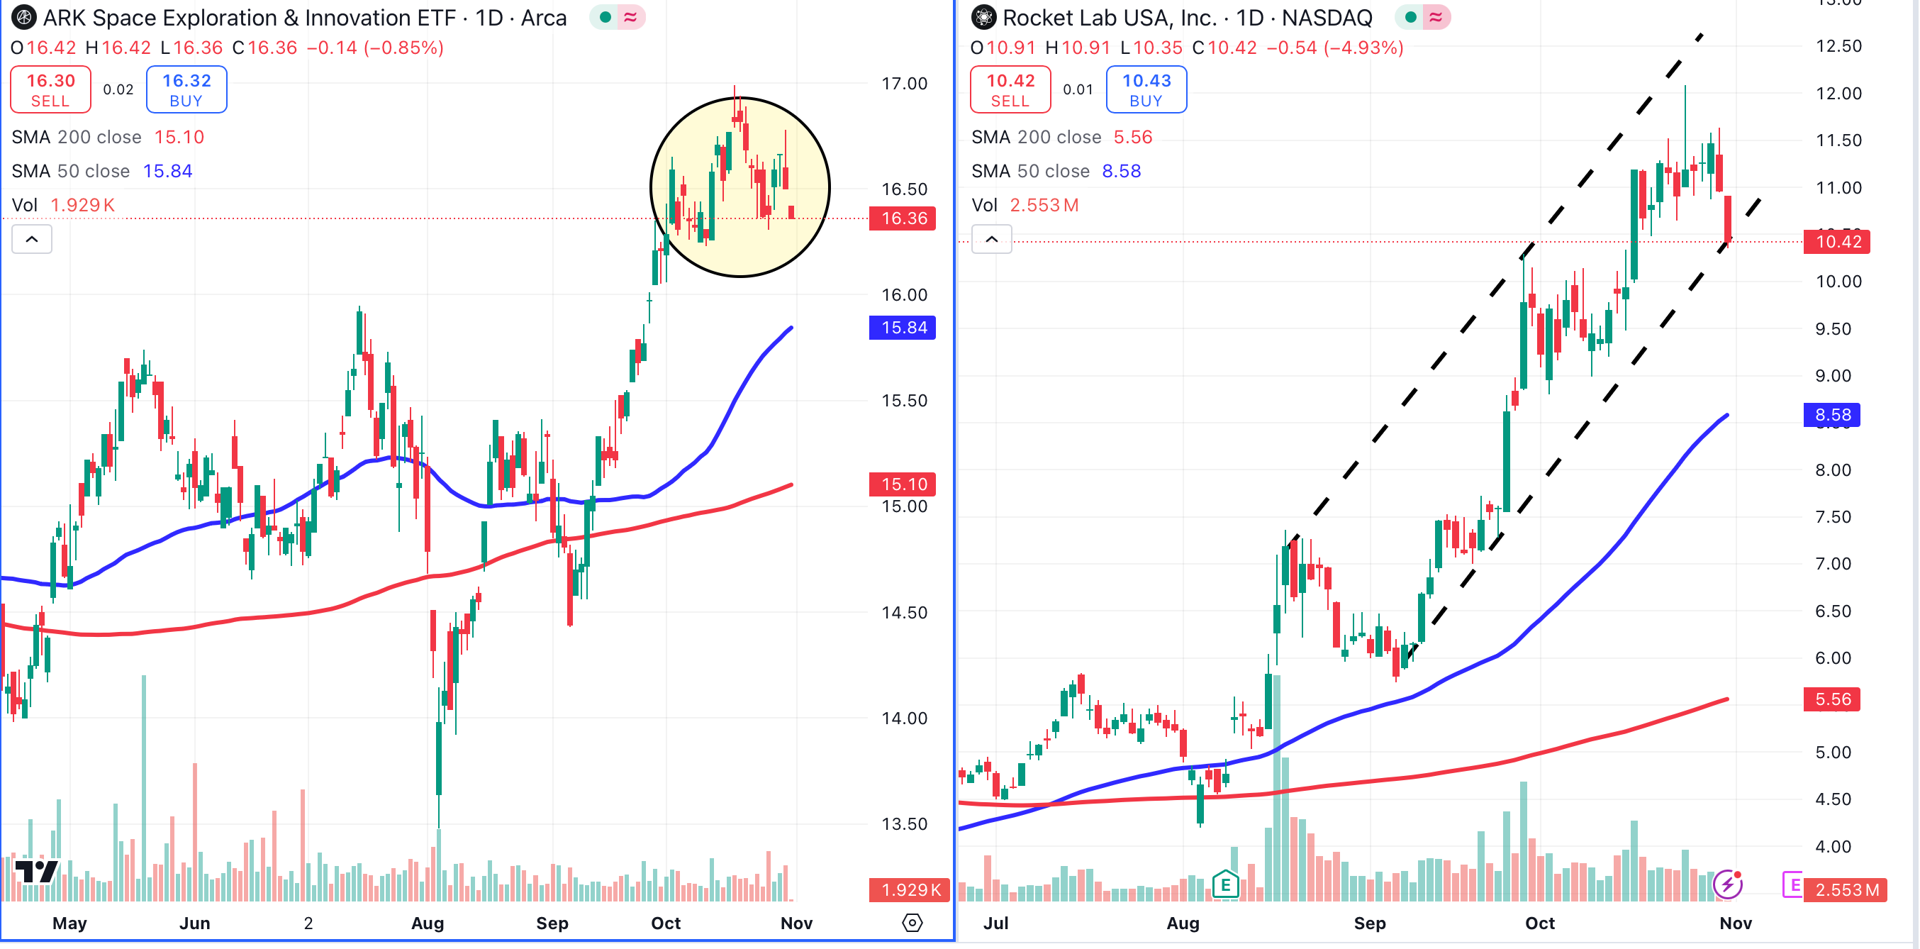
I’m currently stalking Rocket Lab USA RKLB, which has soared by 97% year-to-date. Rocket Lab (right chart) is currently pulling back, but remains in a steep bull channel. Steep trend lines are easy to break, so I’m waiting to see if this one holds.. Rocket Lab is scheduled to report earnings on November 12.
Cybersecurity Sector
The First Trust Nasdaq Cybersecurity ETF CIBR, a position in TheStreet Pro Portfolio, has formed a lower high (LH) and a lower low (LL) after reaching an all-time closing high on October 14 (H). This opens the door for a pullback to the ETF’s 50-day moving average (blue).
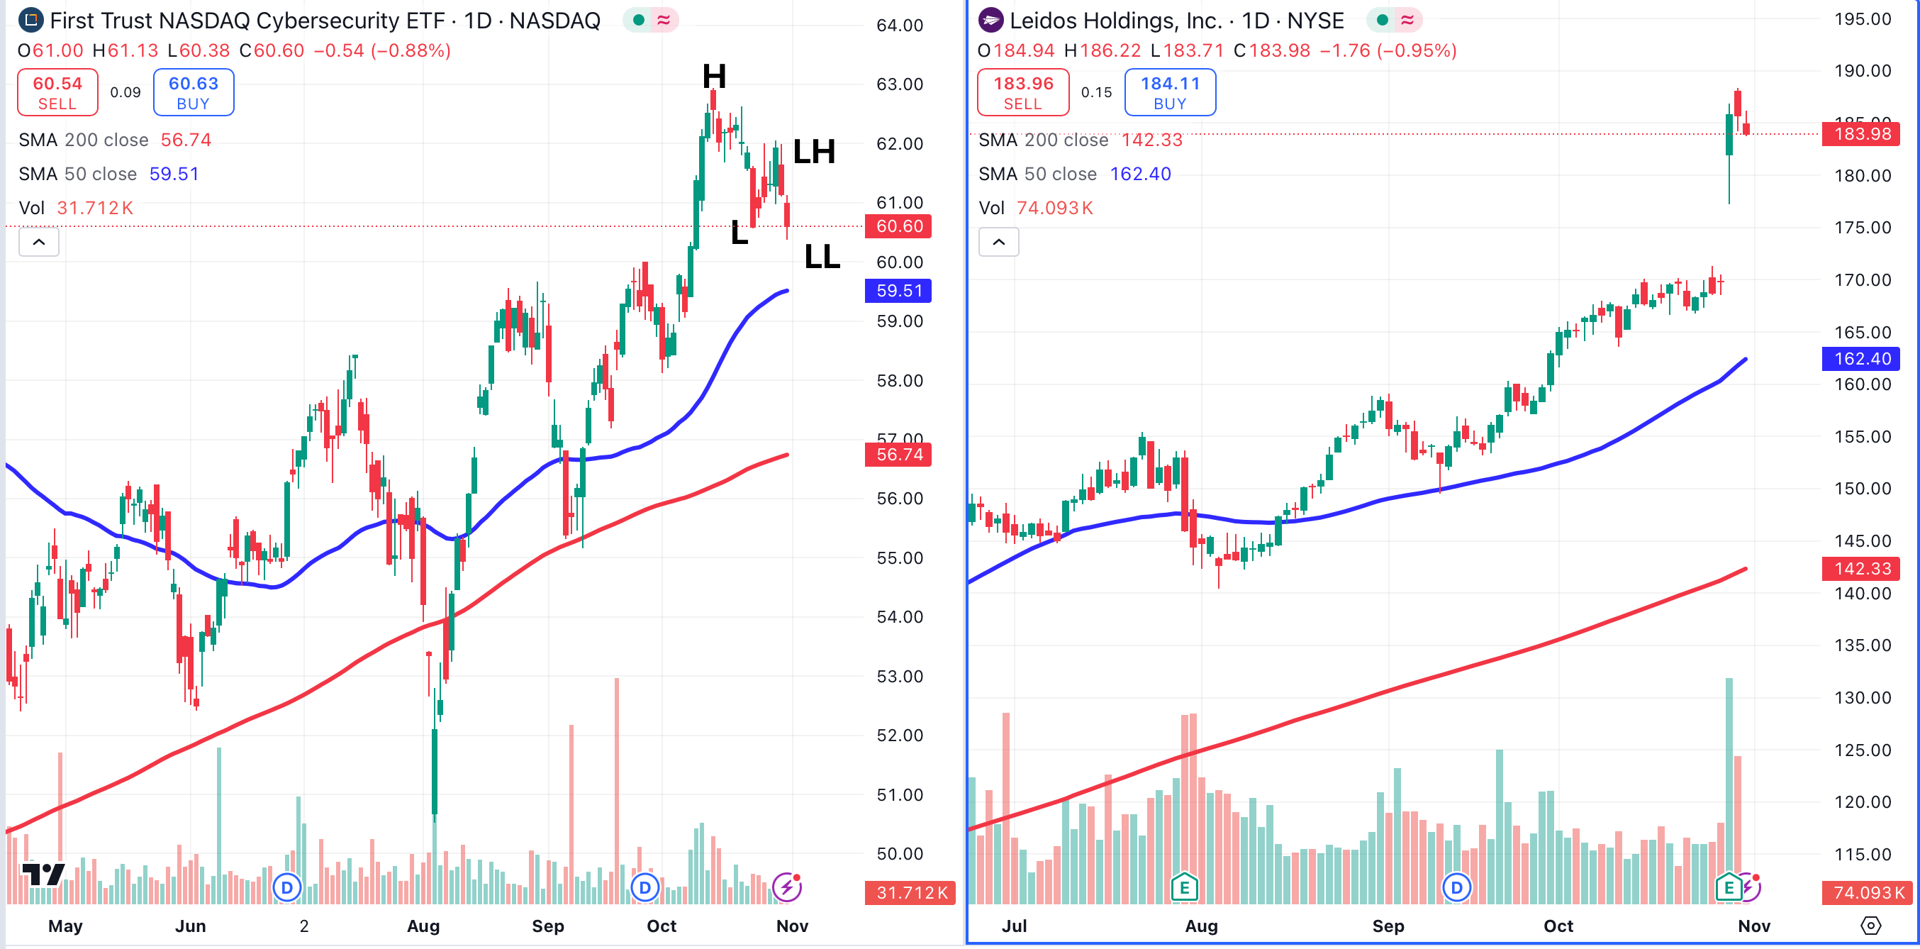
If that pullback occurs, it could pull Reston, Virginia-based Leidos Holdings LDOS back to earth. Leidos soared after crushing earnings expectations by 45% earlier this week, so a pullback would be a welcome sight for hopeful buyers. The stock is up 70% year-to-date.
At the time of publication, Ponsi had no positions in any securities mentioned.
