Grading the Top Airlines as Jet Fuel Prices Slide — Only One Gets an A
Here’s how the airline stocks stack up right now with jet fuel prices pulling back over the past two months.
You've reached your free article limit
You've read 0 of 1 free Pro articles.

Due to the war in the Middle East, and its impact on fuel prices, the airline sector has lost ground this year. After a major rally in the sector on Wednesday, are airline stocks preparing for takeoff?
The U.S. Global Jets ETF (JETS) is a bellwether for the sector. The ETF features over 50 global airlines, but is heavily weighted toward the big names in U.S. commercial aviation.
JETS took off for a 6.5% gain on Wednesday, but the rally stopped at the ETF’s 200-day moving average (red).
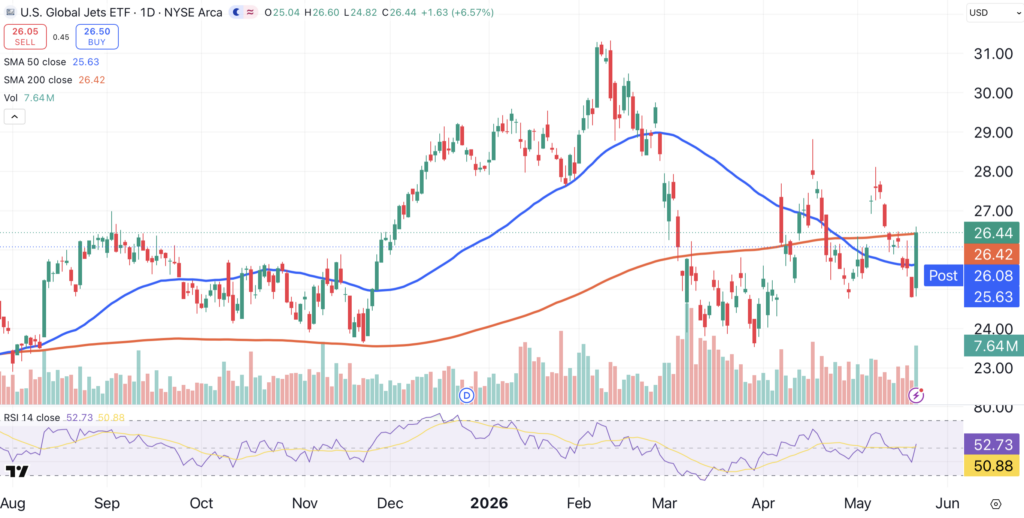
Despite Wednesday’s rally, the U.S. Global Jets ETF is still down 6.5% on the year. However, there are positive signs for the sector going forward.
Jet Fuel Falling
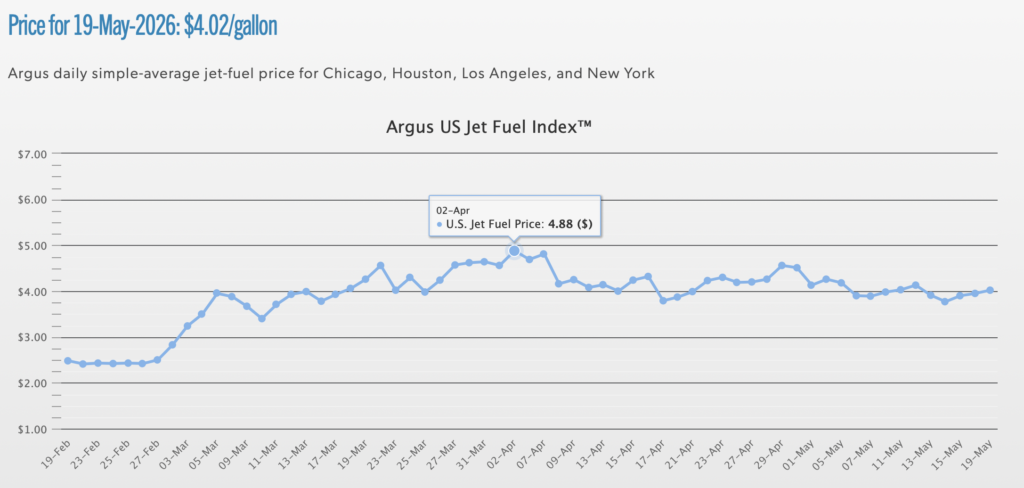
For the past six weeks, jet fuel prices have been steadily falling.
According to the Argus U.S. Jet Fuel Index, prices peaked at $4.88 per gallon back on April 2. Jet fuel has been trending lower ever since, recently trading at just over $4 per gallon.
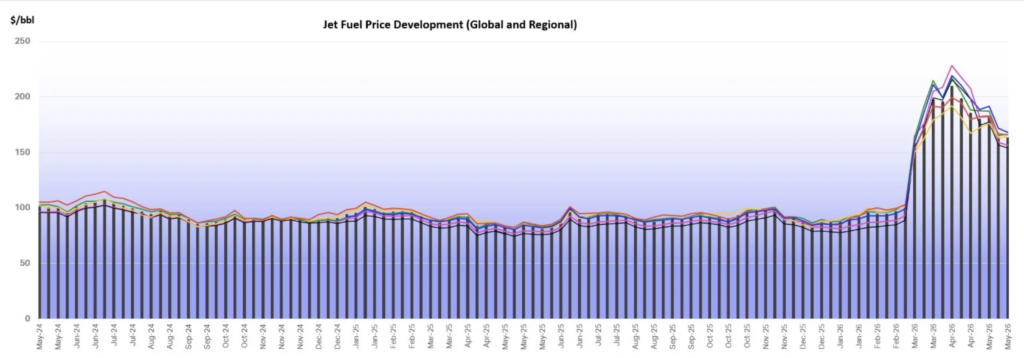
A separate reading from the IATA (International Air Transport Association) shows a recent price of $162 per barrel, down from about $200 in early April.
Airline stocks moved higher on Wednesday, but a wide variance is visible in their individual charts. Let’s go to those charts to see which airline stocks are best positioned for a rebound.
Delta Air Lines
Delta (DAL) is up against resistance in the mid-$70s (horizontal black line), but an additional rise of about 3% would put the stock at an all-time high.
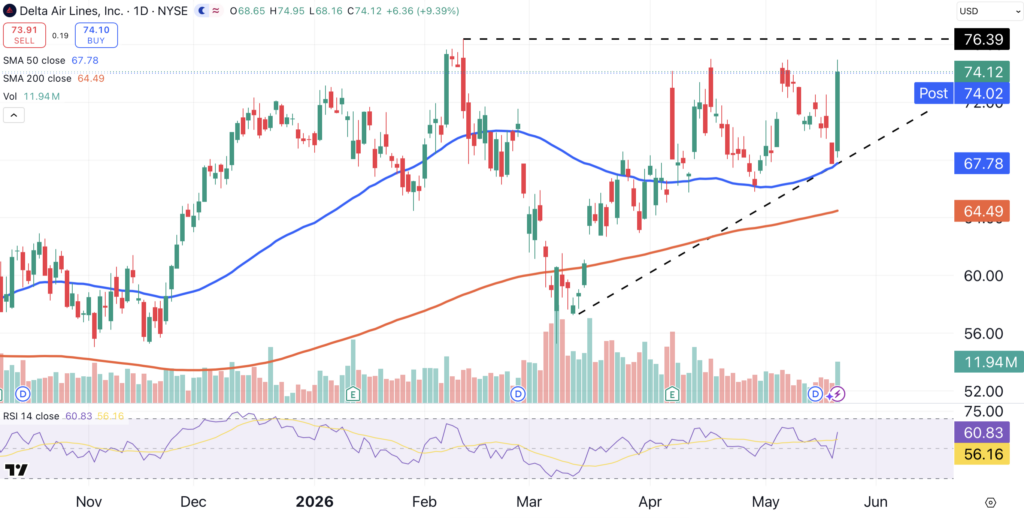
Delta has formed a bullish ascending triangle (black dotted lines). Based on this pattern, our price target for the stock is $85.
GRADE: A-
American Airlines
American Airlines (AAL) has been quietly trending higher for the past two months (black dotted line). The stock is down 16% year-to-date, but has gained nearly 6% over the past month.
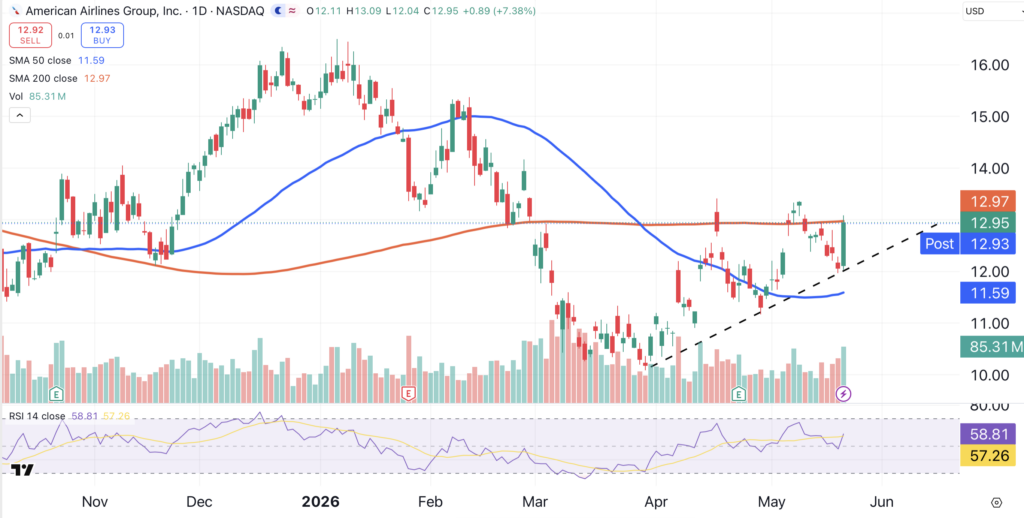
On Wednesday, the Fort Worth, Texas-based carrier closed just 40 cents below its highest level in nearly three months.
GRADE: B+
United Airlines
The chart for United Airlines (UAL) is similar to American Airlines, with one major difference —there is no bullish trend visible, and therefore no bullish trendline to support recent price action.
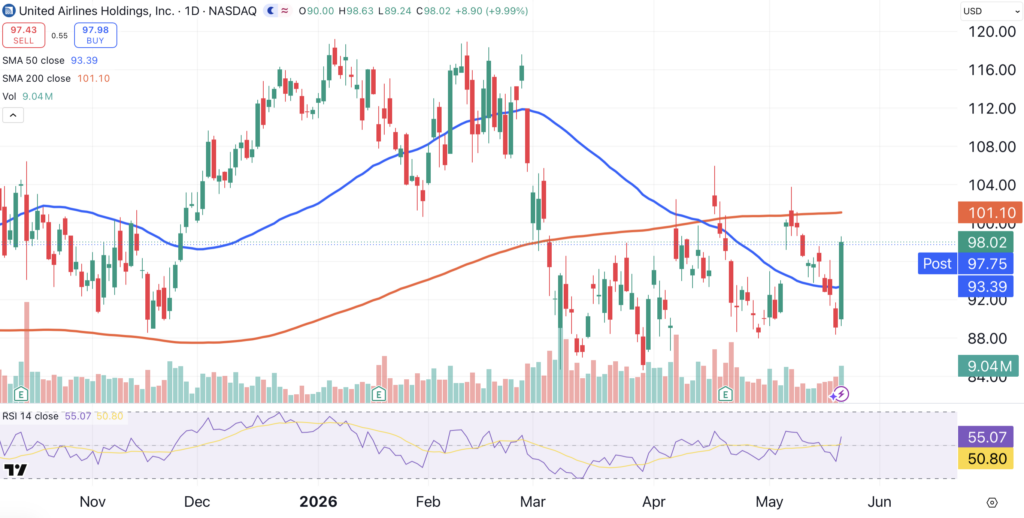
United Airlines is down 13% this year, but roared higher by nearly 10% on Wednesday. A rally above $106 would place the stock at its highest level in nearly three months.
GRADE: B
Southwest Airlines
Down just 3% on the year, Southwest Airlines (LUV) is close to turning positive for 2026. However, Southwest has barely moved off of its year-to-date low, and faces significant overhead resistance.
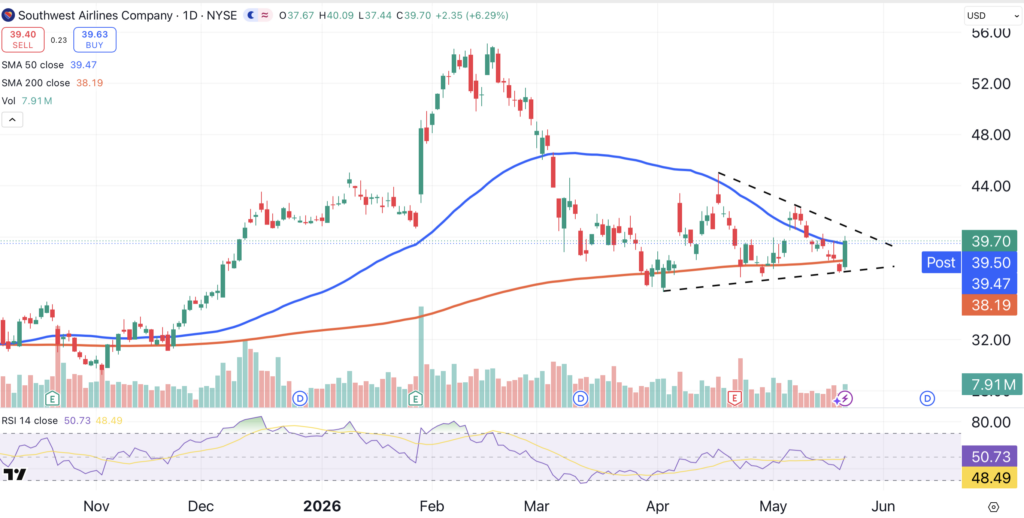
Southwest has formed a symmetrical triangle (black dotted lines), a pattern that has no directional bias. The airline is underperforming its peers despite Wednesday’s 6.3% gain.
GRADE: B-
At the time of publication, Ponsi was long DAL and AAL.
