Weekly Roundup: The Froth Comes Off Big Tech
During a week of notable market rotation, our chip stocks took a hit while several non-tech positions mitigated the negative impact on the portfolio by moving higher.
You've reached your free article limit
You've read 0 of 1 free Pro articles.
Coming into this week, we noted our view that the stock market was overbought, and its valuation stretched — and that that would keep us on a disciplined path with the portfolio and its longer-term focus. While the market ebbed and flowed higher early this week, it culminated in one of its worst weeks in the last three months even though the expectation for multiple rate cuts this year climbed.
Comparing the performance of the S&P 500 and the Nasdaq Composite this week against that of the equal-weighted S&P 500 and the small-cap heavy Russell 2000 points to a market rotation. Yet when we look at quarterly results and guidance from the likes of ASML Holding ASML and Taiwan Semiconductor TSM this week, it’s clear the outlook for the basket of Big Tech companies remains bright. While we’re benefiting from the rebound in our non-tech holdings, what we’re likely seeing is some of the froth coming out of Big Tech and the market. It was bound to happen, and it’s a healthy thing for the market.
The question we are now pondering is how much further could the S&P 500 fall before investors start back on the prowl.
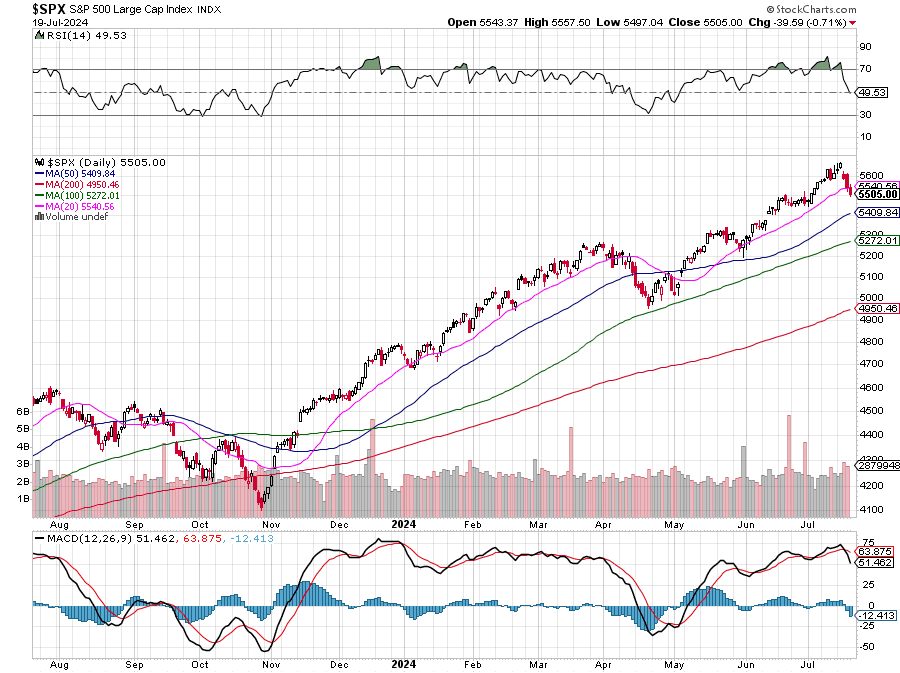
Looking at the S&P 500 as it closed out the week, its relative strength index was back to a more neutral reading just below 50, but one that is far from oversold. That’s far better than the overbought readings we saw a week ago, but with the index closing this week below its 20-day moving average (5540.94), the next layer of support is the 50-day moving average (5409.99).
June-quarter earnings season now shifts one gear higher, with far more companies reporting next week than this past one, so earnings expectations for the S&P 500 for H2 2024 will be another factor to consider. Based on the latest tally from FactSet, H2 2024 EPS for the S&P 500 is now expected to climb 10.3% compared to H1 2024, down from 11% at the end of June and 12.6% at the end of March.
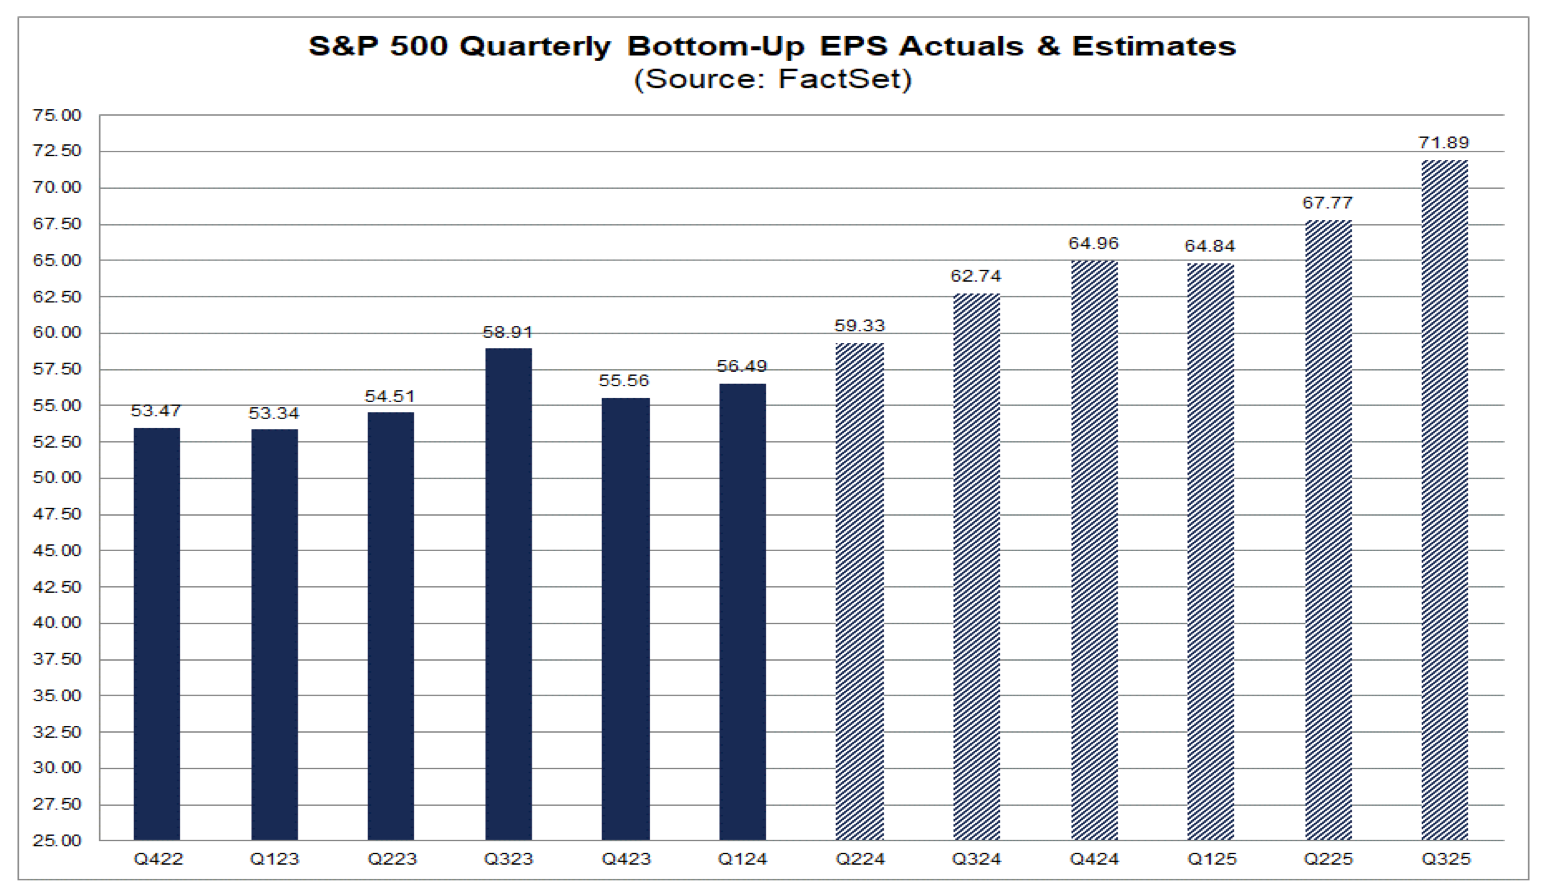
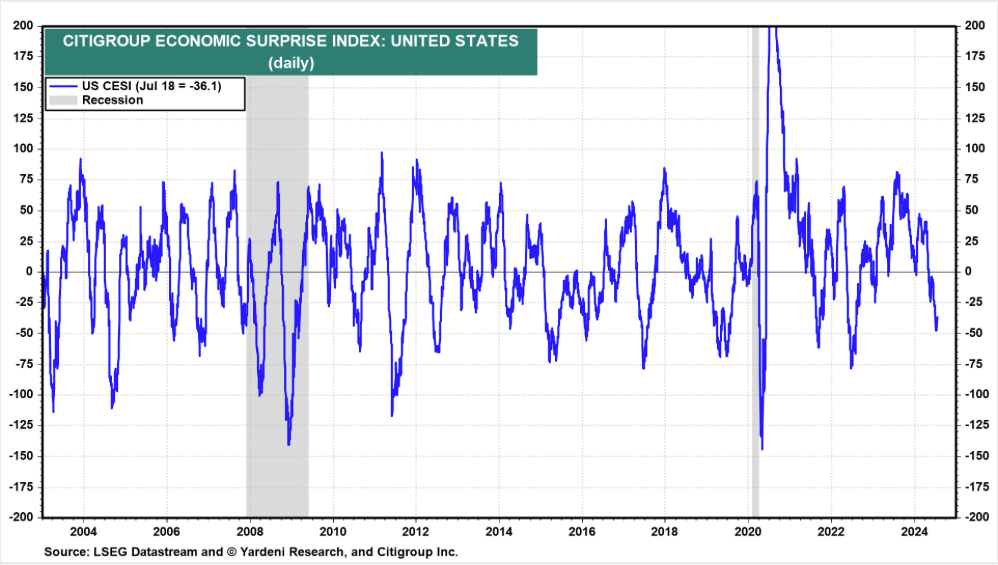
We’re not surprised by that decline considering some of the recent earnings reports and the weaker-than-expected economic data captured by Citibank’s Economic Surprise Index.
Nevertheless, remember our comments over the last few weeks that for the market to move sustainably higher, we would need to see H2 2024 EPS exceptions for the S&P 500 move higher. With 86% of the S&P 500 to report in the coming weeks, it’s too early to say we won’t see such a move unfold and that’s why, as we explained in Friday’s video, we’ll be watching these updates like a hawk for two reasons. One for the market’s likely direction and two because that EPS growth rate will be one of the portfolio’s hurdle rates.
The reason why we’re focused on quality EPS growth that is faster than the S&P 500, in addition to the fundamentals and technicals, is simple. Companies that deliver higher quality and superior EPS growth tend to see multiple expansion. Combined with EPS growth, that is fuel for higher stock prices relative to the market. To use Wall Street lingo, we’re talking about “alpha.” We’ve seen the benefits of that on the portfolio in 2024, and as we navigate June-quarter earnings season and beyond, we’ll stick with that strategy.
Catching Up on the Portfolio This Week
The market’s retrenchment was felt in the portfolio, with a greater impact on our chip positions despite the supportive earnings report from Taiwan Semiconductor. We did see higher moves in a number of our non-tech positions, including United Rentals URI, Waste Management WM, Bank of America BAC, Builders First Source BLDR, and several others.
Because of the data points we have collected as it relates to data center growth and chip demand, and the rebound underway in PCs and smartphones that should accelerate thanks to the AI on device upgrade cycle, we’re inclined to be patient with our holdings in Nvidia NVDA, Marvell MRVL, Apple AAPL, Qualcomm QCOM, and Universal Display OLED.
Concerns over potentially another round of export controls for semi-cap equipment to China weighed on shares of Applied Materials AMAT. Those shares moved past the support levels we shared with you on Wednesday, but at the end of the week, they were closing in on being oversold. We agree with comments made by lithography company ASML that 2025 looks to be a brighter year for semi-cap equipment, and that may lead us to pick up more AMAT stock in the coming days if the right opportunity presents itself. Part of that decision process will include what we see in quarterly results from Applied competitor Lam Research LRCX on July 31.
Following robust quarterly results from Morgan Stanley MS and Bank of America BAC we lifted our MS price target to $120 from $110 and our BAC's to $49 from $43. On Thursday, we used the vibrant June-quarter results and guidance for data center, AI, and smartphones found in results from Taiwan Semiconductor to pick up some additional shares of Marvell and Qualcomm. We booked a hefty gain on a slice of our SPDR Gold shares GLD position to help fund those buys.
Later that day, we reiterated our $560 price target for Elevance Health ELV but downgraded our rating to Two from One for United Rentals. We also discussed price levels at which we would reconsider our Two rating for Costco COST as well as Adobe’s tally for Amazon’s haul during 2024 Prime Day.
Friday’s IT outage led us to discuss the potential impact on the portfolio’s positions in the First Trust Nasdaq Cybersecurity ETF CIBR, including levels at which we would be interested in acquiring additional shares. In that Alert, we also explained why the outage and efforts to ensure the odds of it never happening again would keep us on the sidelines with Microsoft MSFT shares at least until the market absorbs the company’s upcoming earnings and guidance. Also on Friday, we detailed what we saw in Netflix’s NFLX earnings report that reinforced our bullish stance on The Trade Desk TTD.
As we begin next week, we will remain disciplined, minding the updates we get as companies report their quarterly results as well as the technicals for our holdings as well as the market. With a little over 9% of the portfolio’s assets in cash, we have room to maneuver, but any larger efforts will likely require culling back an existing position or two. One hurdle we'll be utilizing should we have to make such a decision will be expected EPS growth compared to the S&P 500, something we talked about in in Friday’s video.
This Week's Portfolio Videos
We cover a lot of ground during the week in our Daily Rundowns videos. If you happened to miss one or more of them, here are some helpful links:
Monday, July 15: Why EPS Growth Will Be the Focus After Powell Speaks Today
Tuesday, July 16: About That Market Rotation
Wednesday, July 17: These Stocks Are Getting Hit. Here’s Our Plan for Them.
Thursday, July 18: Here's How We're Dealing With All This Market Volatility
Friday, July 19: Netflix Reporting Says Good Things Ahead for This Holding
Key Global Economic Readings
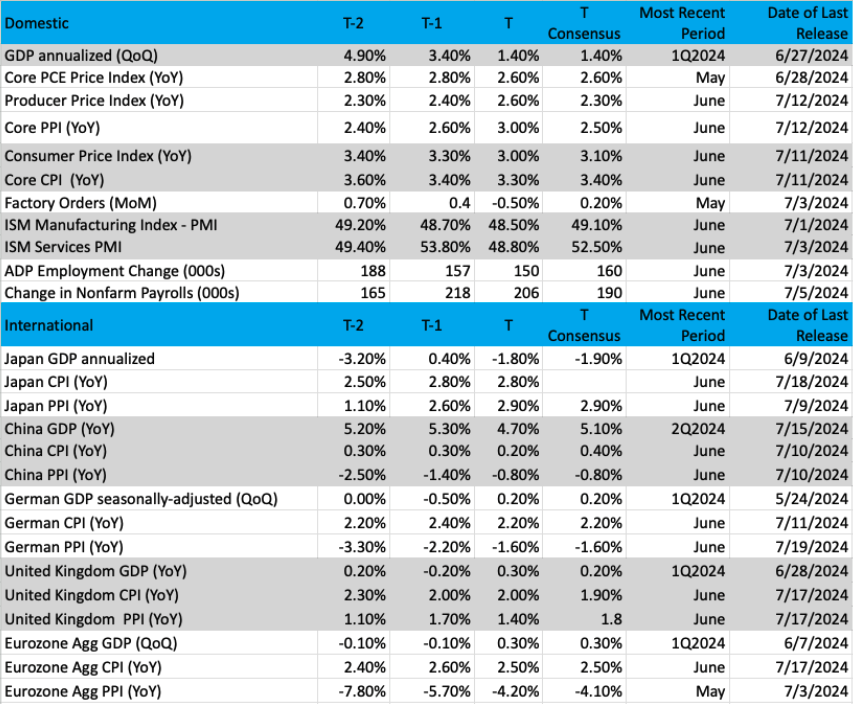
(Note: T is the most recent period, T-1 is the prior period's reading and T-2 is two periods back, the intent being to illustrate any trends)
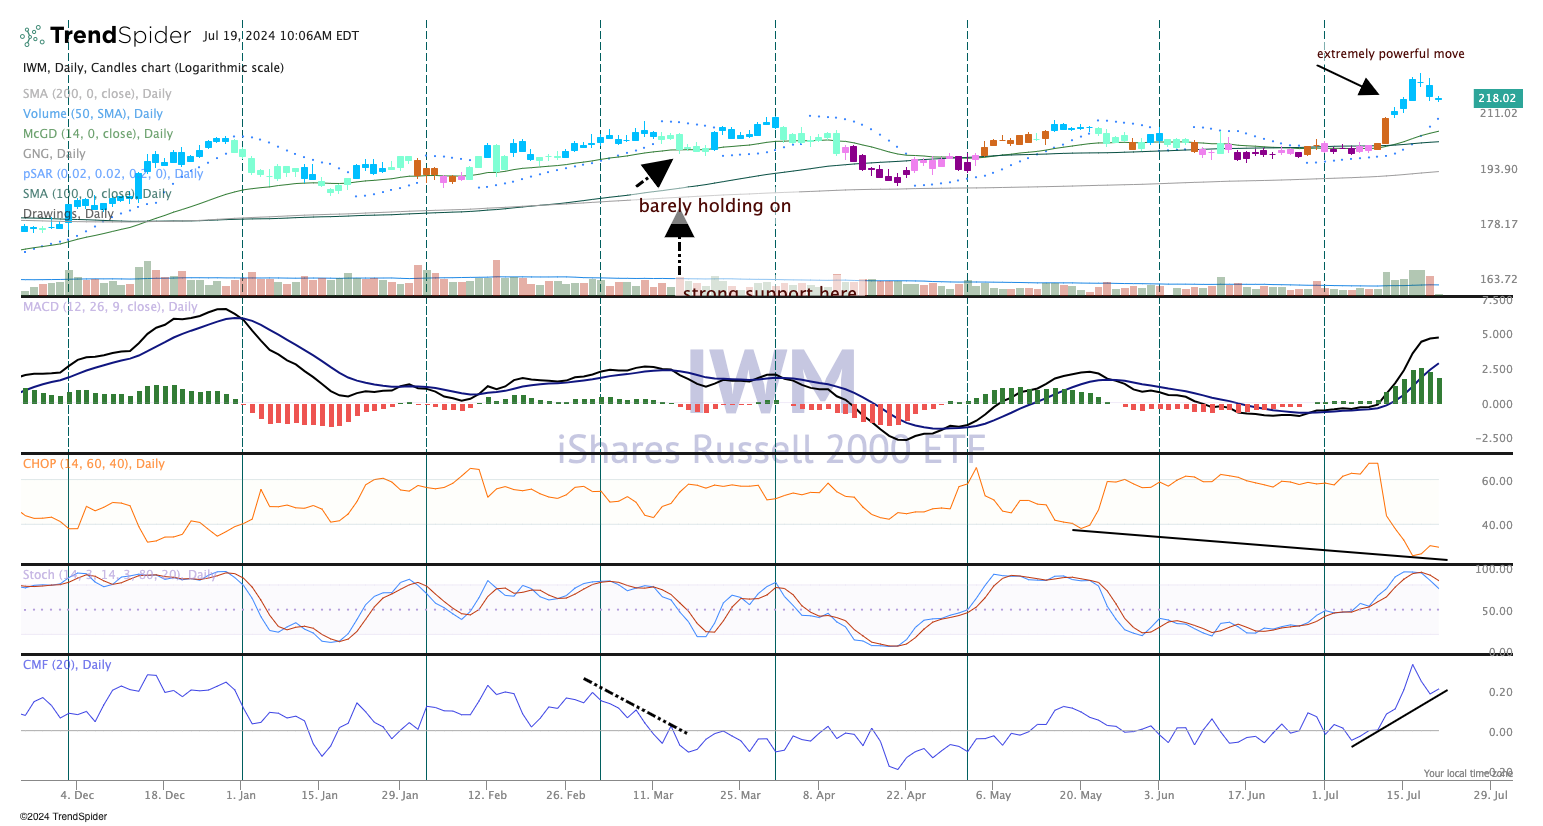
Chart of the Week: iShares Russell 2000 ETF
What a week it has been for the small-cap stocks. Since the June CPI release on July 11, it has been all systems go for the iShares Russell 2000 ETF IWM, which has rocketed higher on heavy turnover.
The attraction to the small-caps, of course, is lower long-term rates, the reason being that lower interest rates mean lower borrowing costs for small companies to finance their businesses. Collectively, the Russell 2000 has companies in the index from a wide variety of groups such as financials, healthcare, biotech, gold miners, retail, and housing-related.
The recent surge in the IWM has been stunning, to say the least. The statistics we read regarding this isolated four-day run (July 11-July 16) tell us it was one of the strongest moves ever seen, a record-setter that was unexpected by the market. At the time, IWM volatility was low and staying low, but since then it has traveled higher by more than 50% (that is the $RVX, which is the Russell 2K volatility index).
What does this all mean? Certainly, with the trend in rates down that bodes well for small-caps to continue higher, but not likely at this recent pace. Still off the all-time highs, the large thrust by the IWM is likely to attract more buyers than sellers, although we could also see a bit of profit-taking. Since it has been so long since the Russell 2000 has led markets higher, traders are likely to test the waters on a dip-buying opportunity, Friday probably being a good example.
As for the chart, below, we see a very long and drawn-out base above the 200-day moving average, and finally a breakout above the stubborn $210 level last week. We see the candles are blue, which is bullish while the money flow is very bullish (bottom pane).
If the bulls are looking for leadership in the IWM, they have certainly found it, with lower interest rates supporting the surge. Small-caps often lead the rest of the market up or down. But remember, it cuts both ways and if rates stay stubbornly high, this recent surge in small-cap stocks may get unwound just as quickly as it rose.
Other charts we shared with you this week were:
Monday, July 15: S&P 500 – Index Tackles New Ground
Monday, July 15: SPDR Gold Shares (GLD) – Gold Shows Great Leadership
Tuesday, July 16: Elevance Health (ELV) – Elevance Needs More Elevation
Wednesday, July 17: Builders FirstSource (BLDR) - Under-the-Radar Stock Is Back on Track
Thursday, July 18: Qualcomm (QCOM) - Our Semiconductor Name Retains Strong Setup After Hit
The Coming Week
We are continuing to monitor the fallout from Friday’s major IT outage, and also any developments concerning the Democratic presidential candidate. Heading into the weekend, rumors are swirling about a potential change, but we won’t fall prey to rumors. Should we see a formal announcement, we’ll factor that into our thinking, but we would remind members that we examine the political landscape for its potential effect on the portfolio. With more than 100 days to go until November 5, that landscape can change a few times. As we get closer to the election and the likely outcome becomes clearer, we’ll start to game out its impact on the portfolio.
There are no Fed speakers next week because the central bank will be in its quiet period ahead of its July 30-31 policy meeting. This means there will be no Fed heads to chime in when we get the Flash July PMI reports and the June PCE Price Index next week. When we examine those numbers, our minds will be on what they say about the speed of the economy, inflation, and job creation. What we’ll be watching out for will be anything in the data that might disrupt the market’s expectation for a slowing economy and multiple rate cuts.
With regard to our construction-related positions, we’ll be digging into the June data for New Home Sales and Existing Home Sales. For our consumer-facing names and because consumer spending is a larger part of the domestic economy, we’ll be looking for confirmation real wage growth continued when we juxtapose the June Personal Income data with the month’s PCE figures.
Here's a closer look at the economic data coming at us next week:
U.S.
Monday, July 22
· Chicago Fed National Activity Index – June (8:30 AM ET)
Tuesday, July 23
· Existing New Home Sales – June (10:00 AM ET(
Wednesday, July 24
· MBA Mortgage Applications Index – Weekly (7:00 AM ET)
· S&P Global Flash Manufacturing & Services PMI – July (9:45 AM ET)
· New Home Sales – June (10:00 AM ET)
· EIA Crude Oil Inventories – Weekly (10:30 AM ET)
Thursday, July 25
· GDP – 2Q 2024 (Initial) – 8:30 AM ET
· Initial & Continuing Jobless Claims – Weekly (8:30 AM ET)
· Durable Orders – June (8:30 AM ET)
· Advanced Inventories (Retail & Wholesale) – June (8:30 AM ET)
· EIA Natural Gas Inventories – Weekly (10:30 AM ET)
Friday, July 26
· Personal Income & Spending, PCE Price Index – June (8:30 AM ET)
· The University of Michigan Consumer Sentiment Index (Final) – July (10:00 AM ET)
International
Tuesday, July 23
· Eurozone: Consumer Confidence (Flash) - July
Wednesday, July 24
· Japan: Jibun Bank Flash Manufacturing & Services PMI – July· Eurozone: HCOB Flash Manufacturing & Services PMI - July
Thursday, July 25
· Eurozone: Loans to Households & Companies - June
As we teased in Friday’s video, next week brings quarterly results from several more portfolio positions, including Lockheed Martin LMT, ServiceNow NOW, United Rentals, and Waste Management. Naturally, we will be focused on the results and guidance, and our expectation is that both will be favorable. With Lockheed, we expect its backlog to tick higher given several large contract wins but the focal point for H2 2024 will be the resumption of F-35 shipments.
On the same day as Lockheed, we’ll also get earnings from Alphabet GOOGL. At 4.1% of the portfolio’s assets, we’re not likely to add further to the position. While we’ll be looking for potential upside to our $200 price target, we’ll also be interested in capital spending comments for H2 2024.
With ServiceNow’s results, AI adoption will be one of the focal points and what it means not only for revenue but also pricing. The second focal point will be management’s comments about IT spending in H2 2024 as companies balance capital budgets for AI and cybersecurity.
This week we downgraded URI shares to a Two rating given the pronounced rebound as the stock market ratcheted up rate-cut expectations. We expect United Rentals will benefit from strength in non-residential construction as well as the improving non-seasonally adjusted data found in the June Housing Starts report.
Those drivers should also benefit Waste Management’s quarterly results, but we will want to see further margin improvement as its rollout of automated trucks continues. We’ll also be looking for more color on the announced acquisition of Stericycle (SRCL). Specifically, we’re interested in how Waste intends to lift Stericycle’s margins closer to its margin profile.
Outside of those reports, we will review quarterly results from:
* SAP SAP and IBM IBM for what they see ahead for IT spending.
* Insights on the mobile chip market from NXP Semiconductor NXPI,
* PulteGroup PHM and Masco MAS for their outlook on new home construction in H2 2024.
* With Lazard (LAZ), our interest will be on how it sees the investment banking landscape unfolding in H2 2024,
* Results from Quest Diagnostics DGX will set the table for quarterly results from Labcorp LH on August 1.
* In Friday’s video, we discussed why Visa’s V guidance will factor into our thinking for Mastercard MA, and we can say the same for Juniper’s JNPR results and Marvell’s non-data center business.
Here's a closer look at the earnings reports coming at us next week:
Monday, July 22
· Open: SAP SE (SAP)
· Close: Crown Castle (CCK), Nucor (NUE), NXP Semiconductor (NXPI).
Tuesday, July 23
· Open: Albertsons (ACI), HCA (HCA), Lockheed Martin (LMT), Paccar (PCAR), PulteGroup (PHM), Quest Diagnostics (DGX), UPS (UPS)
· Close: Alphabet (GOOGL), Tesla (TSLA), Visa (V),
Wednesday, July 24
· Open: AT&T (T), Silicon Labs (SLAB)
· Close: IBM (IBM), KLA Corp. (KLAC), ServiceNow (NOW), United Rentals (URI), Waste Management (WM).
Thursday, July 25
· Open: Comcast (CMCSA), Dover (DOV), Dow (DOW), Honeywell (HON), Keurig Dr Pepper (KDP), Lazard (LAZ), Masco (MAS), Northrop Grumman (NOC), Pool (POOL), STMicroelectronics (STM)
· Close: Deckers Outdoors (DECK), H&E Equipment (HEES), Juniper Networks (JNPR), Roku (ROKU). Terex (TEX).
Friday, July 26
· Open: 3M (MMM), Colgate Palmolive (CL), Sensient (SXT).
Portfolio Investor Resource Guide
· Economic Data: Here's a List of Links to the Key Economic Data We Closely Watch
· Investing Terminology: 16 Key Terms Club Members Should Know
· 10-Ks: Want to Know About a Stock? Read the Company's Reports
· 10-Qs: Unlock the Numbers and Key Information Behind Your Stock With the 10-Q
· Income Statement: Our Cheat Sheet to Understanding This Financial Document
· Balance sheet, Cash Flow Statements, and Dividends: How to Know If a Company Is Off-Kilter? Read Its Balance Sheet
· Valuation Metrics: Everyone Wants a Value. Here's How Investors Can Find
The Portfolio Ratings System
1 - Buy Now (BN): Stocks that look compelling to buy right now.
2 - Stockpile (SP): Positions we would add to on pullbacks or a successful test of technical support levels.
3 - Holding Pattern (HP): Stocks we are holding as we wait for a fresh catalyst to make our next move.
4 - Sell (S): Positions we intend to exit.
