Chart of the Day: Gold Shows Great Leadership
The yellow metal is ready to break out from a consolidation period.
You've reached your free article limit
You've read 0 of 1 free Pro articles.
Not even a benign CPI for June could keep gold down for very long. The metal has been consolidating after a very strong run in the spring. Sideways action following a period of strength is healthy, we just don't know how long it will last. But as Louise Yamada (famed technician) tells us, "the longer the base, the higher the space."
In other words, a nice two to three-month consolidation period means when the stock/index breaks out that should lead to a very long move (up or down). In this case, as the SPDR Gold Shares has been showing a base in the higher end of a long-term view, the odds favor moving in the direction of the recent trend.
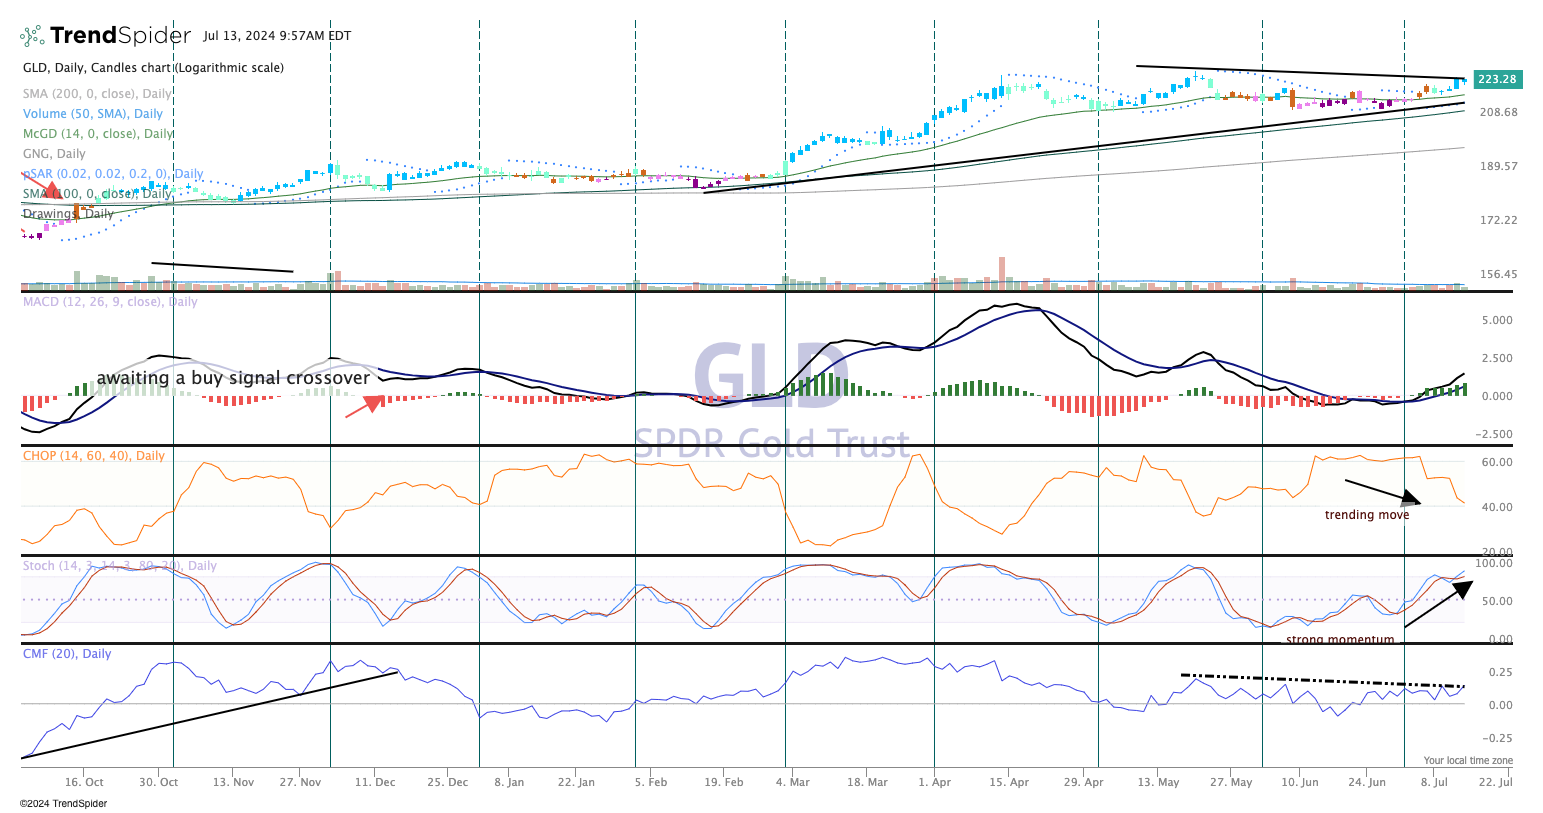
As for the technical condition, money flow (bottom pane) is flattening out but momentum is getting stronger. Stochastics are nearly overbought.
The big surprise was the nearly 2% move higher last Thursday and follow-through on Friday. Moving Average Convergence Divergence (MACD) remains on a buy signal crossover, while the parabolic SAR (dots on the top pane) just flipped bullish, so there are indicators telling us this next move is real and may be strong.
The chop indicator (pane 3) tells us a trending move is about to occur, so hold on tight!
At the time of the publication, TheStreet Pro Portfolio was long GLD.
