Charting the S&P 500: Index Tackles New Ground
Multiple new highs the past week tells us how strong this index really is.
You've reached your free article limit
You've read 0 of 1 free Pro articles.
Simply amazing action in the S&P 500 the past couple weeks. In fact, as we see in this weekly chart it has been several weeks, as the blue candles show us in the top pane. While many have tried to say "halt" to the market rally, we know better than to tell the market what it should be doing. In fact, this trend could last for some time, as even the pullbacks since late April have been shallow, corrective and short in duration.
The technical condition of the market could not be more bullish. In fact, the last few weeks strengthened that idea even more. The Chop index, shown in the third pane, is moving down, but by definition that means a trending move is underway.
Stochastics remain bullish and are embedded, which means dips are being bought by the "pros." MACD (moving average convergence/divergence) remains on a strong buy crossover.
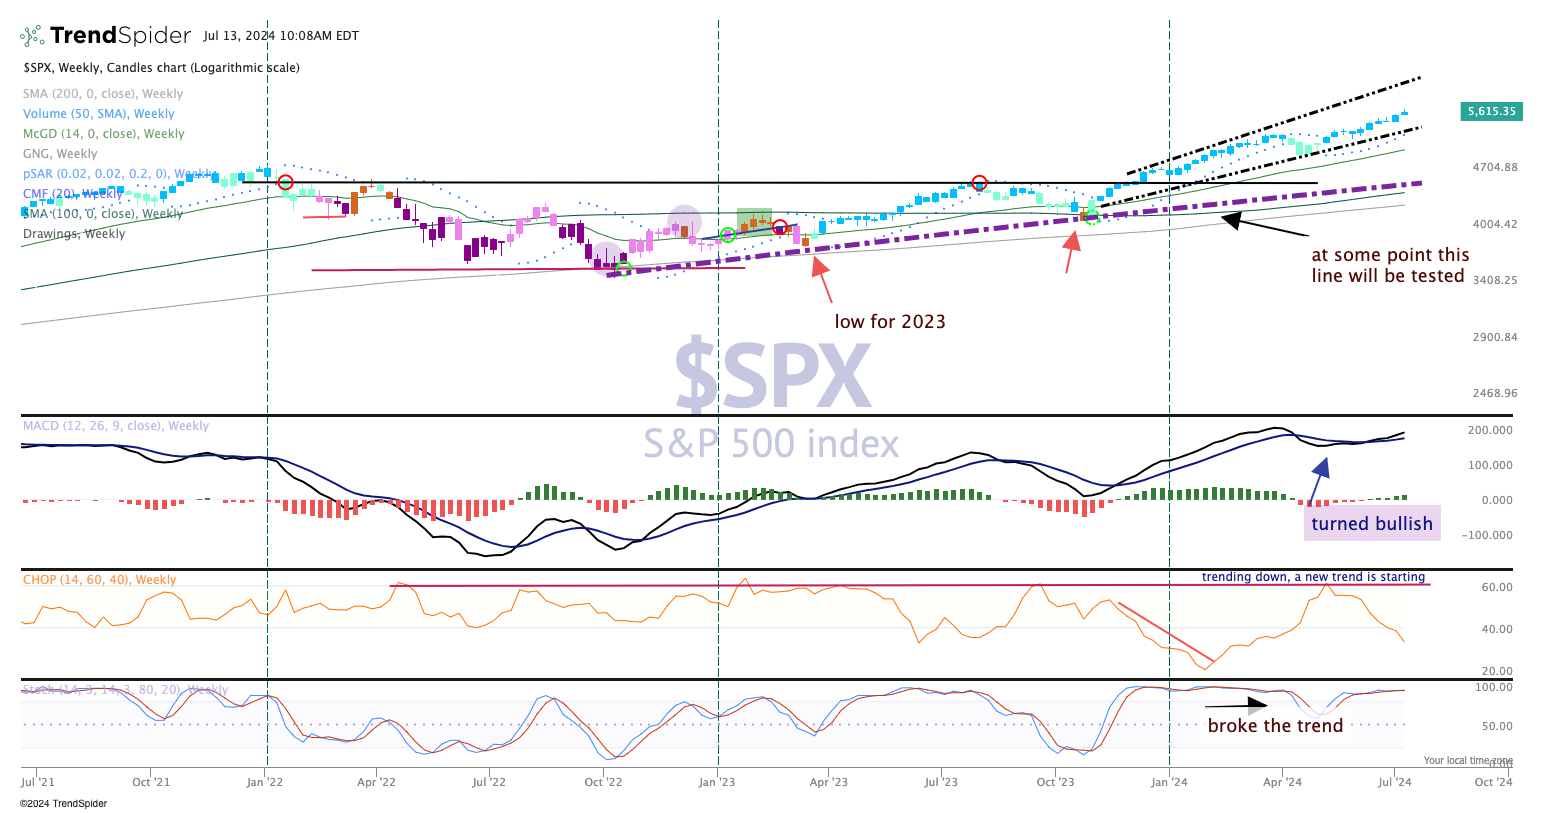
We made a slight adjustment to the channel in the top pane, which narrows the range and raises the top side of the channel. This adjustment also served to lower the target a bit. A tighter range is more realistic here with low implied volatility (VIX at 12.5%), meaning the market is not expecting too much movement.
