Weekly Roundup: Rotating Back to the Start
The market's performance this week lifted the portfolio, and the standout position was a double-digit move in Builders FirstSource.
You've reached your free article limit
You've read 0 of 1 free Pro articles.
Stocks powered ahead this week on the back of more rate-cut-friendly signaling by Fed Chair Powell, and further inflation progress captured in Thursday’s June CPI report. Thursday also brought talk of a market rotation with a move lower in several Big Tech stocks and gains in other parts of the market.
We saw this rotation unfold in several of our holdings, including more interest rate-sensitive ones such as Builders FirstSource BLDR. But sizing this week’s gains for the S&P 500, which lagged the equal-weighted S&P 500 index (SPEW), paints an even clearer picture. To be clear, this is a good thing and has the potential to lift the market higher from here.
Coming into this week, we noted the market was overbought and the S&P 500’s valuation was getting rather stretched. During the week, we discussed how this will place more pressure on the need to see greater earnings growth for the coming quarters than currently expected by market consensus forecasts for the S&P 500. Plain and simple, with the S&P 500’s currently multiple, if we want to see more P, we will need to see more E.
While Thursday’s pullback in the S&P 500 and Nasdaq Composite provided some relief from those conditions, Friday’s rebound put the S&P 500 back near record highs and also back into overbought territory. In other words, we’re right back where we were earlier this week, which means earnings growth will be a key factor in determining the market’s move forward. We will continue to focus on companies with far better EPS growth prospects than the S&P 500.
Much was said this week about the upcoming presidential election. Because of the portfolio, we’ll continue to take a wait-and-see approach, drilling down on potential policy implications as the election and its outcome draw near.
When we return from the weekend, we have little on the earnings front on Monday and a relatively bare economic calendar. This will see the market focus on Fed Chair Powell’s comments midday on Monday. Because of what we saw in Friday’s June PPI report, we strongly suspect Powell’s comments will not be as rate-cut-friendly as they were earlier this week. Because of the upturn we spotted in the data, our thinking is Powell will reiterate the Fed’s need to see more good data.
The market has a knack for getting ahead of itself on rate-cut timing as well as the number of potential cuts. Given the current market conditions, we’ll continue to let the data help guide our hand so we can avoid any potential pitfalls for the portfolio.
Catching Up on the Portfolio This Week
The market's performance this week lifted the portfolio further. As we discussed in Friday’s video, several holdings that we lifted our price targets for during the week, including Apple AAPL, Nvidia NVDA, and Universal Display OLED, performed well.
The standout in the portfolio this week was a double-digit move in Builders FirstSource BLDR, which put that position into the black. That was followed by pronounced gains in United Rentals URI and Coty COTY. Those gains and others were mitigated by week-over-week declines in Costco COST, despite it finally announcing the long-awaited membership price increase, and some of our Big Tech shares. However, even with this week’s retrenchment, those Big Tech holdings have been powerful portfolio players, and we have reasons to think their march higher is far from over.
Because we expect the stock market’s valuation to come into focus once this week’s June inflation data has passed, we will be examining the portfolio to see which holdings are overbought following massive runs over the last several weeks. What we find could lead to some prudent portfolio management, something that if it came to pass would also inch the portfolio’s cash position higher.
Should the early innings of the current earning season lead the market to pull back like it did last April, our focus for new and existing positions will be on companies with superior earnings prospects over the coming quarters.
This Week's Portfolio Videos
We cover a lot of ground during the week in our Daily Rundowns and the Portfolio Podcast. If you happened to miss one or more of them, here are some helpful links:
Monday, July 8: The Market Setup Looks Similar to April. Here’s Why That’s Good
Tuesday, July 9: Samsung Event Can Bring Big Boost to This Portfolio Holding
Wednesday, July 10: These Are the Next Hurdles for the Market
Friday, July 12: Here’s Where the Market’s Rebound Leaves Us
Key Global Economic Readings
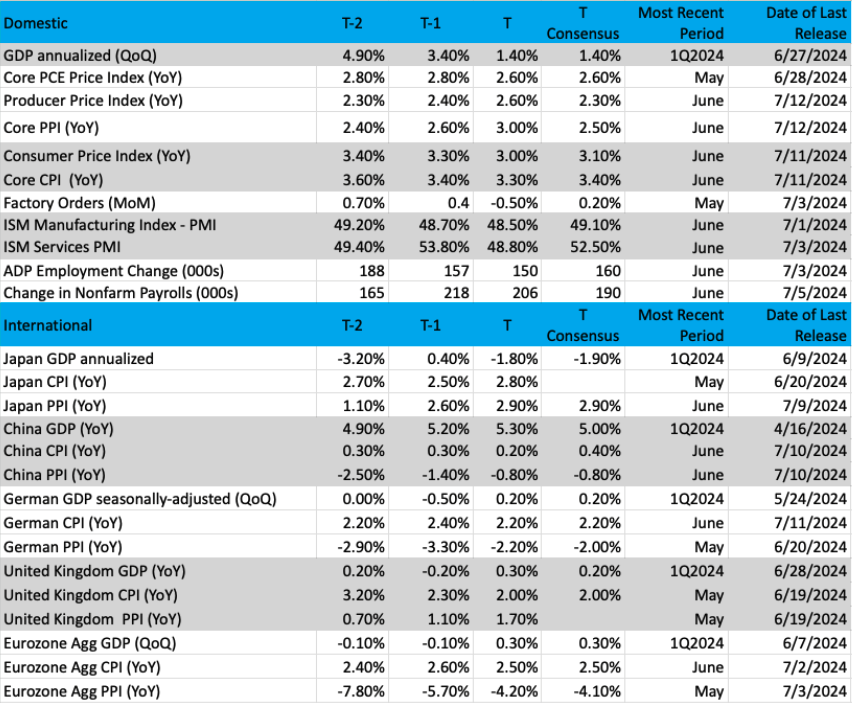
(Note: T is the most recent period, T-1 is the prior period's reading and T-2 is two periods back, the intent being to illustrate any trends)
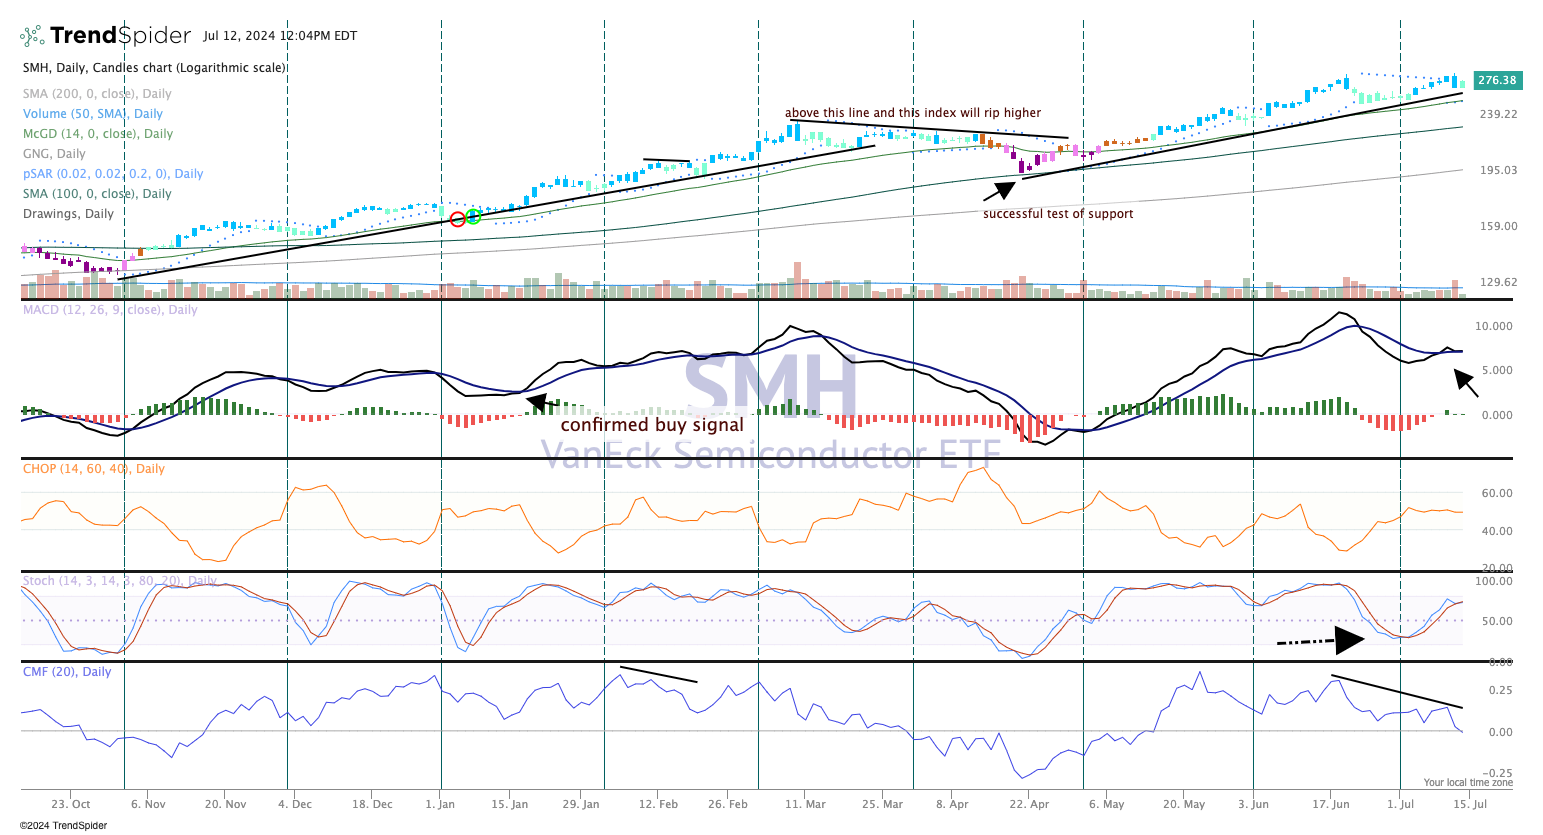
Chart of the Week: The VanEck Semiconductor ETF
Market leadership has not been broad-based over the past six months, but that may soon be changing. A recent charge by small-cap stocks is significant in that the Russell 2000 index (IWM) can carry all markets with it either up or down.
Early this year, market leadership was found within the semiconductor stocks, specifically the VanEck Semiconductor ETF (SMH). What name has been leading this ETF? Why Nvidia (NVDA) of course, which has long tentacles and touches other names specific to AI and other new applications.
So far, SMH is up a whopping 57% in 2024 — and that is not a typo. This index has demonstrated strong leadership and strength during the year and even a modest correction in late April did not deter the bulls. Notice that the Moving Average Convergence (MACD) signal in early May was confirmed, and then it was off to the races.
The current chart shows a textbook pattern of higher highs and higher lows. That is bullish and has been since early May. Money flow seems to be an issue — it is bending lower. We think this can be attributed to profit-taking; the same exact chart pattern happened in the spring when the ETF was at new highs (then a pullback).
Momentum is getting charged up and the stochastics indicator looks ready to go overbought. A pullback perhaps to the $255-$260 area might be enough for dip buyers to add SMH. Keep an eye out for that range on a move lower.
Other charts we shared with you this week were:
Monday, July 8: Nasdaq 100 (NDX) – Nasdaq 100 Is Still Where the Power Lies
Monday, July 8: PepsiCo (PEP) – Pepsi Pulls Back Before a Big Earnings Report
Tuesday, July 9: ServiceNow (NOW) - Why Now Is Not the Time to Buy This Stock
Wednesday, July 10: Applied Materials (AMAT) - Applied Materials Keeps Pushing Forward
Thursday, July 11: Costco (COST) - Costco's Dip May Soon Be Worth Buying
The Coming Week
The trickle of quarterly earnings turns into something more next week, and it will be complemented by a few key pieces of June economic data. Among them, we’ll be digging into the latest Retail Sales report, which will provide context for Costco’s stellar June comp sales. It will also give us further insights and table stakes for Q2 2024 results from other consumer-facing companies, including our stake in Amazon AMZN.
This week’s CPI data was very constructive for Fed rate cuts, and that led to a pop in Builders First Source (BLDR), United Rentals (URI), and Vulcan Materials (VMC) late in the week. However, Friday’s June PPI report and the trend we spotted in the year-over-year core PPI data were not. Our thinking is this will force the Fed to reiterate the need to see more good data before embarking on rate cuts.
Fortunately, we will be getting a variety of July, August, and September data before the Fed concludes its September policy meeting. Near-term, the market is likely to hang on Fed Chair Powell’s comments on Monday, which given the PPI data, may not be as rate-cut-friendly as they were earlier this week.
When we examine next week’s June Housing Starts report we’ll focus on the non-seasonally adjusted data and single-family housing starts. That data for April and May pointed to a quicker pace for that construction activity compared to the December and March quarters. If we see that strength continue in the June data, it will be another positive for our BLDR thesis as well as supportive for URI, VMC, and to a lesser extent Waste Management (WM).
The other piece of data we’ll be eyeing is the June Industrial Production report. In it, we’ll have a keen interest in what it shows about the manufacturing economy because it will help us delineate between the growth shown in the June PMI report from S&P Global vs. the contraction found in the analogous report from ISM.
As we digest those reports, we’ll be watching the impact on the Atlanta Fed’s GDPNow model, which was revised this week to 2.0%. We discussed that revision with you here. Should the data we get next week lead that model to be revised lower for the June quarter, the probability it will be digested favorably by the market is high. The reason for that? Not-so-good or even bad economic news will be viewed as good news for spurring the Fed that much closer to starting its rate-cutting cycle. And as we saw this week, that scenario would be supportive of our construction-related holdings.
Here's a closer look at the economic data coming at us next week:
U.S.
Tuesday, July 16
· Retail Sales – June (8:30 AM ET)
· Import/Export Prices – June (8:30 AM ET)
· Business Inventories – June (10:00 AM ET)
· NAHB Housing Market Index – July (10:00 AM ET)
Wednesday, July 17
· MBA Mortgage Applications Index – Weekly (8:30 AM ET)
· Housing Starts & Building Permits – June (8:30 AM ET)
· Industrial Production & Capacity Utilization – June (9:15 AM ET)
· EIA Crude Oil Inventories – Weekly (10:30 AM ET)
· Fed Beige Book – 2 PM ET
Thursday, July 18
· Initial & Continuing Jobless Claims – Weekly (8:30 AM ET)
· Leading Indicators – June (10:00 AM ET)
· EIA Natural Gas Inventories – Weekly (10:30 AM ET)
International
Monday, July 15
· China: GDP – 2Q 2024
· China: Industrial Production, Retail Sales – June
· Eurozone: Industrial Production - May
Tuesday, July 16
· Eurozone: ECB Bank Lending Survey
Wednesday, July 17
· Eurozone: Inflation Rate (Final) - June
Thursday, July 18
· Eurozone: ECB Interest Rate Decision
Friday, July 19
· Japan: Inflation Rate - June
We have three portfolio holdings reporting next week – Bank of America, Morgan Stanley, and Elevance on Tuesday and Wednesday. For the first two, we’ll get some final clues on Monday from Goldman Sachs (GS) and for Elevance we’ll be interested in comments from United Health (UNH) on Tuesday.
Outside of those reports, because of our positions in Applied Materials (AMAT), Builders FirstSource, Nvidia, Marvell, Apple, Qualcomm, Universal Display, and Mastercard, we will also be digging into quarterly earnings and guidance from ASML (ASML), D.R. Horton (DHI), Taiwan Semiconductor (TSM), and American Express (AXP).
Outside of those earnings reports, we will be assessing participation and related reports about Amazon’s 2024 Prime Day event that spans July 16-17.
Here's a closer look at the earnings reports coming at us next week:
Monday, July 15
· Open: BlackRock (BLK), Goldman Sachs (GS)
Tuesday, July 16
· Open: Bank of America (BAC), Morgan Stanley (MS), PNC (PNC), United Health (UNH)
· Close: Interactive Brokers (IBKR), JB Hunt (JBHT).
Wednesday, July 17
· Open: ASML (ASML), Elevance Health (ELV), Johnson & Johnson (JNJ), Synchrony Financial (SYF)
· Close: Alcoa (AA), Crown Castle (CCI), Discover Financial (DFS), Steel Dynamics (STLD), United Airlines (UAL).
Thursday, July 18
· Open: Abbott Labs (ABT), DR Horton (DHI), Domino’s Pizza (DPZ), Taiwan Semiconductor (TSM)
· Close: Netflix (NFLX), PPG Industries (PPG).
Friday, July 19
· Open: American Express (AXP).
Portfolio Investor Resource Guide
· Economic Data: Here's a List of Links to the Key Economic Data We Closely Watch
· Investing Terminology: 16 Key Terms Club Members Should Know
· 10-Ks: Want to Know About a Stock? Read the Company's Reports
· 10-Qs: Unlock the Numbers and Key Information Behind Your Stock With the 10-Q
· Income Statement: Our Cheat Sheet to Understanding This Financial Document
· Balance sheet, Cash Flow Statements, and Dividends: How to Know If a Company Is Off-Kilter? Read Its Balance Sheet
· Valuation Metrics: Everyone Wants a Value. Here's How Investors Can Find
The Portfolio Ratings System
1 - Buy Now (BN): Stocks that look compelling to buy right now.
2 - Stockpile (SP): Positions we would add to on pullbacks or a successful test of technical support levels.
3 - Holding Pattern (HP): Stocks we are holding as we wait for a fresh catalyst to make our next move.
4 - Sell (S): Positions we intend to exit.
ONES
Alphabet GOOGL; $185.07; 1,035 shares; 4.19%; Sector: Communication Services
WEEKLY UPDATE: Shares of Alphabet GOOGL were trending higher early this week along with the market but fell sharply on Thursday along with several other Big Tech stocks. However, the uptrend is still intact, a textbook uptrend of higher highs and higher lows. Volume trends are bullish, and this recent quick pullback seems to have burned off the overbought condition, a good move to let others start picking at the stock. We see the stock is making a recovery attempt to re-capture the all-time highs set just earlier in the week above $192. Our price target remains $200, but we will revisit that as fresh data warrants it. In the news, Google’s cloud unit is exploring options to fight against Microsoft’s licensing practices. HubSpot (HUBS), which had been rumored to be in talks to be acquired by Alphabet, fell sharply as the plug was pulled on the deal. Google said healthcare partners can now access Fitbit’s irregular heart rhythm detection data via web API. TD Cowen maintains a Buy on Alphabet and raised its price target to $220. Jefferies and DBS Bank also have Buy ratings and $220 targets on the stock. Data from Statcounter shows Google regained search engine market share in June, putting it at its highest level during the quarter. Alphabet reports earnings on July 23 after the close.
1-Wk. Price Change: -2.9%; Yield: 0.4%
INVESTMENT THESIS: We believe that while search and digital ad dominance are what will carry shares in the near- to mid-term, longer-term it is the company's artificial intelligence "moat" that will provide for new avenues of growth. AI is what has made the company's search, video, and targeted ad capabilities best-in-class and is the driving force behind the company's success in voice (Google Home) and autonomous driving (Waymo). Furthermore, we believe it is this AI expertise that will also make the company more prevalent in other industries, including healthcare via its subsidiary Verily, as AI and machine learning continue to disrupt operations across industries. Lastly, adding to our positive view of the company's future opportunities, we believe that Alphabet's free cash flow generation and solid balance sheet set it apart and are what will allow the company to continue taking chances on far-out ground-breaking and potentially world-changing projects. The company is also preparing to roll out Gemini Subscription with enterprise plans for workspace, according to a report. All good news for Alphabet.
Target Price: Reiterate $200; Rating: One
Panic Point: $145
RISKS: Regulatory risk (data privacy), competition, and macroeconomic slowdown impacting consumers and therefore ad buyer activity.
Amazon AMZN; $194.49; 835 shares; 3.54%; Sector: Consumer Discretionary
WEEKLY UPDATE: Despite the modest retreat this week, make no mistake, Amazon AMZN shares have been a portfolio champ so far this year. Next week brings a few catalysts for the shares in the form of the June retail sales report and the company’s annual Prime Day sales event that spans July 16-17. We suspect both will be positive for Amazon’s North American digital shopping business, with the Prime Day results setting the company up for some bragging on its upcoming earnings call. We continue to see Amazon as well-positioned as shoppers re-embrace digital shopping, especially as they contend with persistent inflation. AI and cloud adoption should remain a tailwind for Amazon Web Services, and we continue to see favorable growth ahead for Amazon’s subscription and advertising offerings. During the week TD Cowen boosted its AMZN price target to $245 from $225. Amazon has yet to share its June-quarter report date, but once we have it in hand, we will share it with members.
1-Wk. Price Change: -2.8%; Yield: 0.0%
INVESTMENT THESIS: We believe upside will result from Amazon's continued eCommerce dominance, AWS's continued leadership in the public cloud space, and ongoing growth of the company's advertising revenue stream, which feeds off Amazon's eCommerce business. Additionally, we believe profitability will continue to improve as AWS and advertising account for a larger portion of total sales as both these segments sport higher margins than the eCommerce operation. While we believe the increasing share of the revenue from these higher margin businesses will be key to driving profitability longer-term, we think margins on eCommerce stand to improve as the company's infrastructure is further built out and economies of scale further kick in. The embedded call option is that management is always looking to enter a new space and generate new revenue streams.
Target Price: Reiterate $220; Rating: One
Panic Point: $155
RISKS: High valuation exposes the stock to volatile swings, eCommerce has exposure to slower consumer spending and competition, management is not afraid to invest heavily, potential headwinds resulting from new eCommerce regulation in India, and management is not scared to invest aggressively for growth, which can at times cause volatile reactions as near-term concerns arise relating to the impact on margins.
Axon Enterprise AXON; $292.66; 623 shares; 3.97%; Sector: Aerospace & Defense
WEEKLY UPDATE: Following the post-March quarter earnings pullback in the shares that unfolded during May, Axon AXON has been making a quiet comeback. We have a nice series of higher highs, and higher lows yet still within a wider downtrend, but a move above $305 may get Axon going in the right direction. We are also closely watching the big gap around $327. Looking at other technicals, money flow is improved while MACD (moving average convergence/divergence) remains on a buy signal. We see the company benefiting from public safety spending as it continues to expand the reach of its cloud business. The continued mix shift toward that higher margin and recurring cloud business should drive further margin expansion and EPS growth. Axon will report earnings on Monday, August 5 but ahead of that report we’ll be digging into quarterly results from competitor Motorola Solutions (MSI).
1-Wk. Price Change: -1.9%; Yield: 0.00%
INVESTMENT THESIS: Axon Enterprise develops, manufactures, and sells conducted energy devices and cloud-based digital evidence management software designed for use by law enforcement, corrections, military forces, private security personnel, and private individuals for personal defense. The company operates in two segments: Taser and Software & Sensors. Taser develops and sells CEDs used for protecting users and virtual reality training. Software & Sensors manufactures fully integrated hardware and cloud-based software solutions such as body cameras, automated license plate reading, and digital evidence management systems. Axon delivers its products worldwide and gets most of its revenue from the United States. President Biden's fiscal year 2023 budget requests a fully paid-for new investment of approximately $35 billion to support law enforcement and crime prevention -- in addition to the President's $2 billion discretionary request for these same programs. According to Mordor Intelligence, the wearable, and body-worn cameras market on its own was valued at $1.62 billion in 2020 and is expected to reach $424.63 billion by 2026.
Target Price: Reiterate $375; Rating: One
Panic Point: $270
RISKS: Manufacturing and supply chain, competitive factors, government regulation, technology change.
Builders FirstSource BLDR; $152.75; 650 shares; 2.18%; Sector: Industrials
WEEKLY UPDATE: Our rationale behind owning BLDR shares in the portfolio stems from the expected improvement in the housing market as the Fed embarks on a rate-cutting cycle, and monetary policy moves back to a more neutral level from being restrictive. Continued improvement in this week’s inflation data hoisted BLDR higher, placing our position into the black and validating our investment rationale. We will continue to monitor upcoming data and rate-cut implications, but we will also be listening to homebuilders during the June-quarter earnings for their comments on the housing market as well as their initiatives, including the adoption of value-added products like those from Builders, to improve their profitability. As part of those efforts, we'll be watching earnings from D.R. Horton (DHI) next week, and PulteGroup (PHM), Tri Pointe Homes (TPH), and Taylor Morrison Home (TMHC) the following one. Builders will report its quarterly results on August 6.
1-Wk. Price Change: 15.2%; Yield: 0.0%
INVESTMENT THESIS: Builders FirstSource is a supplier and manufacturer of building materials, manufactured components, and construction services to professional homebuilders, sub-contractors, remodelers, and consumers. The company’s top-10 customers account for 15% of net sales and are comprised primarily of the largest national production homebuilders, including publicly traded companies such as D.R. Horton, Dream Finders Homes, Lennar Corp., Pulte, Taylor Morrison Home, and Toll Brothers. The company is leveraging its national manufacturing footprint to grow its higher-margin value-added products as homebuilders look for more efficient ways to construct homes. We see this driving faster revenue and earnings growth in the coming quarters as the eventual rate-cutting cycle by the Fed lifts the demand for housing.
Target Price: $205; Rating: One
Panic Point: $115.
RISKS: Economy, interest rates, commodity pricing, and supply chain risks.
Coty Inc. COTY ; $10.44; 15,540 shares; 3.53%; Sector: Consumer Discretionary
WEEKLY UPDATE: Shares of this beauty company have been a drag on the portfolio for the last several weeks but became a nice contributor this week. Even though BofA Securities reduced its COTY price target to match our $14 target from $15, the firm kept its Buy rating intact. Piper Sandler also reiterated its Overweight rating on COTY. Meanwhile, Jefferies upgraded fragrance company Inter Parfums (IPAR) to Buy citing the oversold condition of the shares following their double-digit drop, while the outlook for the fragrance market remains favorable. We could make that same comment for COTY shares given the slump between late February and last week. Ahead of Coty’s earnings reports, we’ll be focused on fragrance and skin care performance from Estee Lauder (EL), LVMH (LVMHF), and other luxury goods companies. We’ll also be looking for support for the meaningful EPS growth in H2 2024 compared to H1 2024 called for in current market consensus forecasts. As we do that, we’ll call out technical resistance between $11-$11.25, which could become a new support level if the shares push through and register a successful re-test.
1-Wk. Price Change: 6.4%; Yield: 0.0%
INVESTMENT THESIS: Founded in Paris in 1904, Coty is one of the world's largest beauty companies with a portfolio of iconic brands across fragrance, color cosmetics, and skin and body care. Coty serves consumers around the world, selling luxury and mass-market products in more than 130 countries and territories. The company derives almost 45% of its revenue from the Americas, 44% from Europe, the Middle East, and Africa, and the balance from Asia Pacific. By revenue category, Prestige drives 62% of Coty's revenue but more than 80% of its operating income with the balance derived from its Consumer Beauty segment. Management intends to further grow the Prestige business, expanding its prestige fragrance brands, through the ongoing expansion into prestige cosmetics, and the building of a comprehensive skincare portfolio leveraging existing brands. Management is also targeting margin improvement at its Consumer Beauty brands as well as expanding its presence in China across both of its reporting segments. China's beauty and personal care market is expected to grow at a quicker pace of 5.4% per annum through 2027, putting it at $70 billion-$75 billion by 2027.
Target Price: $14; Rating: One
Panic Point: $9.00
RISKS: Industry competition and consolidation, product efficacy and safety, currency, and brand licensing.
Marvell Technology MRVL; $73.59; 2,510 shares; 4.03%; Sector: Technology
WEEKLY UPDATE: Following the 40% increase to Taiwan Semiconductor’s (TSM) June-quarter revenue and upsized quarterly revenue from Corning (GLW), we reiterated our One rating and $95 target for Marvell MRVL. While those reports were clear positives for Marvell’s business and our shares, as we collect confirming signs for the expected rebound in Marvell’s enterprise networking and carrier infrastructure spending, we’ll circle back to our price target. During the week, KeyBanc boosted its MRVL target to $95 from $90, matching ours. The next catalyst to watch for MRVL shares will be quarterly results and guidance next week from TSM. When Microsoft, Alphabet, Amazon, and Meta (META) report, with Marvell in mind, we’ll be focused on their capital spending about capital spending and proprietary chip progress.
1-Wk. Price Change: 2.1%; Yield: 0.3%
INVESTMENT THESIS: Marvell is a fabless supplier of high-performance standard and semi-custom infrastructure semiconductor solutions. These solutions power the data economy, enabling the data center, carrier infrastructure, enterprise networking, consumer, and automotive/industrial end markets. With roughly 75%-80% of Marvell's revenue stream tied to digital infrastructure, we see it continuing to benefit from rising content consumption and creation. Pointing to that rising demand that necessitates network densification and the build of digital infrastructure, Ericsson sees global monthly average usage per smartphone reach 46 gigabytes (GB) by the end of 2028 vs. 19 GB in 2023 and 15 GB in 2022.
Target Price: Reiterate $95; Rating: One
Panic Point: $59
RISKS: Technology risk, customer risk, competition risk, reliance on manufacturing partners, and supply chain constraints.
Nvidia Corp. NVDA; $129.24; 1,510 shares; 4.28%; Sector: Technology
WEEKLY UPDATE: We boosted our price target for NVDA shares this week to $148 from $132 following the findings in Taiwan Semi’s June revenue report and raised June-quarter revenue guidance from Corning (GLW). Others followed suit, including KeyBanc which boosted its target to $180 from $130 and UBS which upped its target to $150 from $120 early this week. Benchmark raised its price target on Nvidia to $170 from $135 and keeps a Buy rating on the shares. The next catalyst to watch for this position will be quarterly results and guidance next week from TSM. When Microsoft, Alphabet, Amazon, and Meta (META) report, we’ll be focused on their capital spending about capital spendings and how they square with Morgan Stanley’s thinking that 2025 capital spending plans will rise to levels that are more than double those for 2023.
1-Wk. Price Change: 2.7%; Yield: 0.0%
INVESTMENT THESIS: Nvidia is well positioned to benefit from ramping AI and data center spending. The company pioneered accelerated computing to help solve the most challenging computational problems. Nvidia is now a full-stack computing infrastructure company with data-center-scale offerings that are reshaping the industry. The company's full stack includes the foundational CUDA programming model that runs on all Nvidia GPUs, as well as hundreds of domain-specific software libraries, software development kits, or SDKs, and Application Programming Interfaces, or APIs. This deep and broad software stack accelerates the performance and eases the deployment of Nvidia accelerated computing for computationally intensive workloads such as artificial intelligence, or AI, model training and inference, data analytics, scientific computing, and 3D graphics, with vertical-specific optimizations to address industries ranging from healthcare and telecom to automotive and manufacturing. Nvidia reports in two business segments: Compute & Networking and Graphics. The Compute & Networking segment (78% of revenue, 85% of operating income) is comprised of Data Center accelerated computing platforms and end-to-end networking platforms including Quantum for InfiniBand and Spectrum for Ethernet; NVIDIA DRIVE automated-driving platform and automotive development agreements; Jetson robotics and other embedded platforms; Nvidia AI Enterprise and other software; and DGX Cloud software and services. The Graphics segment (22% of revenue, 15% of operating income) includes GeForce GPUs for gaming and PCs, the GeForce NOW game streaming service and related infrastructure; Quadro/NVIDIA RTX GPUs for enterprise workstation graphics; virtual GPU, or vGPU, software for cloud-based visual and virtual computing; automotive platforms for infotainment systems; and Omniverse Enterprise software for building and operating metaverse and 3D internet applications.
Target Price: $148; Rating One
Panic Point: $100
RISKS: Market and interest rate risk, credit risk, country risk, and operational risk, including cybersecurity.
The Trade Desk TTD; $99.48; 1,570 shares; 3.40%; Sector: Technology
WEEKLY UPDATE: The Trade Desk TTD has been flirting with a breakout for several weeks, but better than that is the stairstep pattern of higher highs and higher lows. That is the pattern we see from the last touch in April at the 200-day moving average. Since then, TTD is up roughly 25% and with some rather strong volume days as well. A nice, smooth ride up is something big institutions like to see rather than the jagged moves seen from most growth stocks. TTD’s technical condition is favorable and as we see in the chart that textbook uptrend pattern is great for dip buyers to enter the stock on down sessions. Needham reiterated a Buy on The Trade Desk, maintaining a $100 price target. We continue to see the company well positioned for the accelerating shift to digital advertising across multiple platforms, especially streaming. Trade Desk will report its next earnings on August 8.
1-Wk. Price Change: -0.4%; Yield: 0.0%
INVESTMENT THESIS: The Trade Desk offers a cloud-based ad-buying platform that empowers its clients to plan and manage data-driven digital advertising campaigns across ad formats and channels, including video, display, audio, digital-out-of-home, and social. Modalities for those campaigns span a multitude of devices, such as computers, mobile devices, televisions, and streaming devices. This positions the Trade Desk to benefit from an accelerating shift toward digital advertising. That shift is expected to see digital advertising account for more than 70% of total ad spending in 2025 rising to ~74% by 2027. We also see the company benefitting from the use of digital advertising in the 2024 presidential campaign, which is expected to grow more than 150% compared to 2024, putting it around $3.5 billion.
Target Price: Reiterate $110; Rating: One
Panic Point: $79
RISKS: Advertising spending; customer risk and loss; evolving market dynamics and competitive landscape; platform disruptions and outages.
United Rentals URI ; $679.56; 232 shares; 3.44%; Sector: Industrials
WEEKLY UPDATE: Recent construction spending data and other indicators have painted a positive demand backdrop for United Rentals URI. In particular, the non-seasonally adjusted non-residential construction spending has sequentially strengthened throughout the year, benefiting from related stimulus spending out of Washington and more favorable weather conditions. Our view has been the eventual move by the Fed to cut rates would lower project hurdle rates, benefiting non-residential construction activity as well as housing construction. As that happens, we should also start to see the benefit of CHIPs Act funding on construction activity. All of this offers a favorable medium to longer-term outlook for United’s business and our shares. Near-term, we will be listening for company comments during the current earnings season for the impact of Hurricane Beryl on their operations and guidance for the current quarter. While that could pose a modest headwind for United in the short term, eventual rebuilding efforts would be another positive. United will report its quarterly results on July 25.
1-Wk. Price Change: 7.2%; Yield: 1.0%
INVESTMENT THESIS: United Rentals, the largest equipment rental company in the world, operates throughout the United States and Canada, and has a limited presence in Europe, Australia, and New Zealand. It serves industrial and other non-construction; commercial (or private non-residential) construction; and residential construction. Industrial and other non-construction rentals represented approximately 50% of rental revenue, primarily reflecting rentals to manufacturers, energy companies, chemical companies, paper mills, railroads, shipbuilders, utilities, retailers, and infrastructure entities; commercial construction rentals represented approximately 46% of rental revenue, primarily reflecting rentals related to the construction and remodeling of facilities for office space, lodging, healthcare, entertainment, and other commercial purposes; and residential rentals around 4% of revenue. We see the company benefiting on three fronts — the seasonal uptick in construction spending; the release of funds and projects associated with the five-year Biden Infrastructure Bill; and the company's nip-and-tuck acquisition strategy that should further enhance its geographic footprint. In January, the company announced a fresh $1 billion buyback authorization following the completion of $4 billion in share repurchases over the 2012-2021 period.
Target Price: Reiterate $750; Rating: One
Panic Point: $550
RISKS: Industry and economic risk, competition and competitive pressures, and acquisition risk.
Universal Display OLED; $225.37; 835 shares; 4.11%; Sector: Technology
WEEKLY UPDATE: On Thursday, following Taiwan Semi’s June revenue report, Samsung’s Unpacked event that introduced its updated foldable smartphone line-up, and reports Apple expects to ship ~90 million iPhone 16 model units in H2 2024, we boosted our OLED price target to $250 from $225. We also repositioned our panic point at $180 from $170. With roughly 50% of the smartphone market penetrated by organic light-emitting diode displays, 3% of the TV market, and 2% of the PC and tablet market, we see a long runway ahead for OLED shares even before we factor in automotive lighting and the general illumination market. Other recent price target increases for OLED shares include Oppenheimer hiking its to $250 from $200, and Needham boosting its to $242 from $198. While Universal has yet to share its June-quarter reporting date, next week’s report and guidance from Taiwan Semiconductor will be the next known catalyst for the shares. Others on the horizon include Apple’s earnings report on August 1, Qualcomm’s on July 31, and those from Skyworks (SWKS) and Qorvo (QRVO).
1-Wk. Price Change: 3.2%; Yield: 0.7%
INVESTMENT THESIS: Universal Display focuses on the development and commercialization of organic light-emitting diode (OLED) technologies and materials for use in display and solid-state lighting applications. OLED displays are capturing a growing share of the display market, especially in the mobile phone, television, monitor, wearable, tablet, notebook, personal computer, augmented reality (AR), virtual reality (VR), and automotive markets. This adoption reflects advantages over competing display technologies with respect to power efficiency, contrast ratio, viewing angle, video response time, form factor, and manufacturing cost. Universal's business strategy is to develop new OLED materials and sell existing and new materials to product manufacturers for display applications, such as mobile phones, televisions, monitors, wearables, tablets, portable media devices, notebook computers, personal computers, and automotive applications, and specialty and general lighting products. The company also looks to license its OLED material, device design, and manufacturing technologies to those manufacturers. As such, Universal has a significant portfolio of proprietary OLED technologies and materials with more than 5,500 patents issued and pending worldwide.
Target Price: Reiterate $250; Rating: One
Panic Point: $180
RISKS: Patent and Intellectual property protection; maintaining OLED manufacturing and customer relationships; technology risk; market risk.
Vulcan Materials Company VMC ; $252.51; 613 shares; 3.40%; Sector: Building Materials
WEEKLY UPDATE: Recent construction spending data and other indicators have painted a positive demand backdrop for Vulcan VMC. In particular, the non-seasonally adjusted non-residential construction spending has sequentially strengthened throughout the year, benefiting from related stimulus spending out of Washington and more favorable weather conditions. Our view has been the eventual move by the Fed to cut rates would lower project hurdle rates, benefiting non-residential construction activity as well as housing construction. As that happens, we should also start to see the benefit of CHIPs Act funding on construction activity. All of this offers a favorable medium to longer-term outlook for Vulcan’s aggregates business and our shares. Near-term, we will be listening for company comments during the current earnings season for the impact of Hurricane Beryl on their operations and guidance for the current quarter. While that could pose a modest headwind in the short term, eventual rebuilding efforts would be another positive. Vulcan has yet to share its June-quarter reporting date. As we wait for that we will be mindful of comments from competitors Martin Marietta (MLM) and Summit Materials (SUM) and engineering and construction companies like privately held Bechtel, Aecom (ACM), and Granite Construction (GVA).
1-Wk. Price Change: 3.4%; Yield: 0.7%
INVESTMENT THESIS: Vulcan Materials operates primarily in the U.S. and is the nation's largest supplier of construction aggregates (primarily crushed stone, sand, and gravel), a major producer of asphalt mix and ready-mixed concrete, and a supplier of construction paving services. Its products are the indispensable materials used in building homes, offices, places of worship, schools, hospitals, and factories, as well as vital infrastructure including highways, bridges, roads, ports and harbors, water systems, campuses, dams, airports, and rail networks. Ramping spending associated with the Biden Infrastructure Law should drive demand for Vulcan's products over the coming years. Vulcan has historically complemented its organic growth prospects by acquiring businesses to expand its geographic reach and product scope. Since 2014, the company has acquired more than two dozen companies, including the 2021 acquisition of U.S. Concrete. That combination has allowed the company to deliver steady top and bottom-line growth over the last decade, with only a modest decline when the pandemic hit in 2020.
Target Price: Reiterate $310; Rating: One
Panic Point: $225
RISKS: General economic and business conditions; dependence on the construction industry; timing of federal, state, and local funding for infrastructure; changes in the level of spending for private residential and private nonresidential construction.
TWOS
Apple AAPL ; $230.54; 790 shares; 3.98%; Sector: Technology
WEEKLY UPDATE: On Wednesday, Taiwan Semiconductor reported its June-quarter revenue rose 40% year over year, a positive for Apple’s AAPL smartphone and PC businesses. On the same day, findings from research firm Canalys showed the PC market rebound continued in the June quarter with Mac sales outpacing the market. Canalys also shared it sees that rebound accelerating in the coming year in part due to AI PCs. Apple is primed to participate when it rolls out its updated macOS later this year includes Apple Intelligence. That combination led us to boost our AAPL price target to $250 from $230 on Thursday. Shortly thereafter, reports indicate Apple expects to ship 90 million iPhone units in H2 2024, up 11% compared to iPhone 15-unit shipments in H2 2023. During the week, Needham upped its AAPL price target to $260 from $220, while BofA lifted its to $256 from $230. The next catalysts we will be eyeing for AAPL hares include TSM’s quarterly results next week as well as those from Apple manufacturing partner Hon-Hai/Foxconn and Qualcomm. Apple will report its June quarter results on August 1.
1-Wk. Price Change: 1.9%; Yield: 0.4%
INVESTMENT THESIS: While we acknowledge that near-to-midterm performance remains heavily influenced by iPhone sales, the dynamic is shifting as investors finally place greater emphasis on Services growth. We are bullish on the 5G upgrade cycle and believe longer-term upside will continue to come as Services revenue grows its share of overall sales. Services provide for a recurring revenue stream at higher margins, a factor that serves to reduce earnings volatility while allowing for a higher percentage of sales to fall to the bottom line; as a result, we believe that Services growth and the installed base, are much more important than how many devices the company can sell in each 90-day period. In addition to improved profitability, we also believe the transparent nature of this revenue stream will demand an expanded price-to-earnings multiple as segment sales grow. Furthermore, we believe that Apple's desire to push deeper into the healthcare arena will help make its devices invaluable as more life-changing features are added and the company works to democratize health records. Lastly, also see upside resulting from increased adoption of wearables (think the Apple Watch) and potential new product announcements such as an AR/VR headset or an update on Project Titan, the company's secretive autonomous driving program.
Target Price: Reiterate $250; Rating: Two
Panic Point: Reiterate $175
RISKS: Slowdown in consumer spending, competition, lack of new product innovation, elongated replacement cycles, failure to execute on Services growth initiative.
Applied Materials Inc. AMAT ; $243.40; 460 shares; 2.47%; Sector: Semiconductor Manufacturing
WEEKLY UPDATE: The portfolio’s position in semi-cap company Applied Materials AMAT may be on the smaller side, but it has been a very good one for the portfolio with its more than 50% move so far this year. We continue to see Applied’s financials improving as rising chip capacity utilization levels drive incremental chip equipment demand and the impact of reshoring spending, like the U.S. CHIPS Act, kicks in. Ahead of that inflection point, which looks to be an H2 2024 event and should reignite revenue and EPS growth, the next catalyst to watch will be quarterly results next week from ASML (ASML) as well as capacity utilization and capital spending comments from Taiwan Semiconductor (TSM). Those events will be followed by Lam Research’s (LRCX) earnings on July 31 and Intel’s (INTC) on August 1.
1-Wk. Price Change: 0.3%; Yield: 0.7%
INVESTMENT THESIS: Applied provides manufacturing equipment, services, and software to the semiconductor, display, and related industries. With its diverse technology capabilities, Applied delivers products and services that improve device performance, power, yield, and cost. Applied's customers include manufacturers of semiconductor chips, liquid crystal, and organic light-emitting diode displays, and other electronic devices. Applied operates in three reportable segments: Semiconductor Systems (73% of 2022 revenue, 78% of 2022 operating income), Applied Global Services (22%, 19%), and Display and Adjacent Markets (5%, 2%). Key customers include Samsung (12% of 2022 sales), Taiwan Semiconductor (20%), and Intel (10%).
Target Price: Reiterate $240; Rating: Two
Panic Point: $195
RISKS: Manufacturing and Supply Chain, Competitive Factors, Government Regulation, Technology Change.
Bank of America Corp. BAC ; $41.60 ; 4,000 shares; 3.64%; Sector: Financial Services
WEEKLY UPDATE: We recently boosted our BAC price target to $43 following the post-Fed stress test dividend increase announced by the company. Ahead of Bank of America reporting its quarterly results on July 16, the blitz of bank earnings on Friday, including those from JPMorgan (JPM), provided clear support for our BAC thesis. Those bank reports confirmed a surge in investment banking revenue as well as wealth management revenue, which bodes very well for BofA’s results. Ahead of that report, we will give another read-through of Friday's earnings conference calls from JPM, Citi, and others, as well as those for Goldman Sachs, on Monday, we’ll be focused on their comments for H2 2024, especially for M&A and IPO activity. To that, we’ll add what we dissect in earnings and guidance from Morgan Stanley on Tuesday, revisiting our BAC price target as needed. As we do that, we will be mindful of NII comments and guidance from those companies and their implications for BofA’s June quarter results. During the week, Piper Sandler upgraded BAC shares to Neutral from Underweight with a price target of $42, up from $37.
1-Wk. Price Change: 2.9%; Yield: 2.3%
INVESTMENT THESIS: Bank of America is one of the world's leading financial institutions, serving individual consumers, small and middle-market businesses, and large corporations with a full range of banking, investing, asset management, and other financial and risk management products and services. The company provides unmatched convenience in the United States, serving approximately 67 million consumer and small business clients with approximately 3,900 retail financial centers, approximately 16,000 ATMs, and award-winning digital banking with approximately 56 million verified digital users. Bank of America is a global leader in wealth management, corporate and investment banking, and trading across a broad range of asset classes, serving corporations, governments, institutions, and individuals around the world. Bank of America offers industry-leading support to approximately 3 million small business households through a suite of innovative, easy-to-use online products and services. The company serves clients through operations across the United States, its territories, and approximately 35 countries. From a reporting basis, the company's business breaks down as follows: Net Interest Income breakdown: Consumer Banking 57%, Global Banking 23%, Global Wealth & Investment Management 14%, and Global Markets 6%; Income Before Tax breakdown: Consumer Banking 42%, Global Banking 27%, Global Wealth & Investment Management 16%, and Global Markets 15%. Bank of America pays a quarterly dividend of $0.22 per share.
Target Price: $43; Rating: Two
Panic Point: $33
RISKS: Financial markets, fiscal, monetary, and regulatory policies, economic conditions, and credit ratings.
Costco Wholesale COST ; $842.90; 210 shares; 3.86%; Sector: Consumer Staples
WEEKLY UPDATE: After Wednesday’s market close, Costco once again reported stellar comp sales, announced its next quarterly dividend, and finally announced the long-awaited increase in its membership price levels. That upcoming membership price increase means we will see EPS expectations for the coming quarters being raised. In response, on Thursday we increased our COST price target to $950 from $880 and boosted our panic point to $750 from $725. We were joined in lifting our price target by Loop Capital which increased its to $970, Evercore ISI took its to $920 from $890, and both Oppenheimer and Stifel reset their targets at $950. Late in the week, we shared a technical look at COST shares, pointing out support at the $820 level and again near $780. Next week’s June Retail Sales will provide greater context for Costco’s adjusted June U.S. comp sales which rose 6.3%. We continue to see Costco well positioned to win consumer wallet share as it wins new members at existing locations and continues to expand its warehouse footprint.
1-Wk. Price Change: -4.8%; Yield: 0.6%
INVESTMENT THESIS: We like Costco's long-term prospects, driven by a club-based operating model that focuses on volumes, not margins, and therefore offers its customers a value proposition of everyday low prices. The strength of this model has created an incredibly loyal customer base with low churn and continued share gains in both bricks-and-mortar and e-commerce. This is a global concept, evidenced by the strength of sales both in the U.S. and abroad, which includes an emerging China opportunity. We see the company's membership model as a key differentiator vs. other retailers and its plans to open additional warehouse locations in the coming quarters should drive retail volumes and the higher-margin membership fee income as well. We also appreciate management's approach to capital returns and their willingness to return cash when it is in excess on the balance sheet.
Target Price: Reiterate $950. Rating: Two
Panic Point: $750
RISKS: Inability to pass through higher costs, fuel prices, weaker consumer, and membership churn.
Elevance Health ELV; $535.54; 275 shares; 3.21%; Sector: Health Care
WEEKLY UPDATE: Shares of Elevance Health ELV have been trading in a wide range over the last several weeks. We continue to favor the shares as the company continues to not only expand its healthcare plan footprint but do so with a focus on containing costs. Ahead of the company’s earnings on July 17, we’ll be digging through earnings and guidance from UnitedHealth (UNH) the day before. Admittedly, others across Wall Street have boosted their ELV price targets in recent weeks to $625-$650. What we learn next week, could give us a reason to revisit our $560 target.
1-Wk. Price Change: 1.0%; Yield: 1.2%
INVESTMENT THESIS: Elevance, formerly Anthem/Blue Cross Health, is a premier healthcare brand that appears to be in the sweet spot for HMO companies. Mostly domestic, this company has a wide reach and coverage across the U.S., serving more than 118 million people via medical, pharmacy, clinical, and care solutions. Founded in 1944, Elevance offers a terrific business model that works in boom or bust economic times. The opportunity to find a company with reliable and dependable revenue and cash flows is right here with Elevance. Revenue growth for this company has surged in recent years, with better than double-digit growth since 2018 as the company thrived during the pandemic.
Target Price: Reiterate $560; Rating: Two
Panic Point: $450
RISKS: With any insurance business the risk is high for changes in regulation and government programs. Since the onset of Obamacare more than 10 years ago, companies like Elevance have changed their model to be more in line with a better cost/benefit analysis, reducing waste and squeezing out excesses (as was outlined and suggested in Obamacare). Separately, as the population increases and ages, there is more opportunity for Elevance to grow, but with those changes, there is a risk. Lastly, competition is brisk with some very strong opponents who keep their costs low (Humana, Cigna, UNH, CVS/Healthnet).
The Energy Select Sector SPDR Fund XLE ; $90.56; 1,345 shares; 2.64%; Sector: Energy
WEEKLY UPDATE: Crude oil remains well bid and with WTI making a nice move this week towards $85 per barrel. XLE shares, however, have not been reflecting that strength of late, but they does appear to have some good support at the $86 level. Energy stocks were strong in early July but have backed off a bit. Natural gas remains weak as higher supply issues are constraining price increases. Natural gas prices are back to those April lows. The economy may be slowing down and as a result demand for fuel may be reduced. This will have us keenly focused on the downside of economic data that could help the Fed get more comfortable with cutting interest rates. We will also keep continue to keep tabs on China’s economy because it is the largest importer of oil. Key XLE holdings ExxonMobil (XOM) and Chevron (CVX) report earnings on August 2.
1-Wk. Price Change: 0.5%; Yield: 3.7%
INVESTMENT THESIS: The Energy Select Sector SPDR Fund is an exchange-traded fund that tracks the performance of the Energy Select Sector Index. The ETF holds large-cap U.S. energy stocks. It invests in companies that develop & produce crude oil & natural gas and provide drilling and other energy-related services. The holdings are weighted by market capitalization.
Target Price: Reiterate $100; Rating: Two
Panic Point: $84
RISKS: Interest rates, weakness in the broad economy, energy prices.
First Trust Nasdaq Cybersecurity ETF CIBR ; $57.68; 2,530 shares; 3.18%; Sector: Cybersecurity
WEEKLY UPDATE: Another week, another batch of headlines on the latest hacks and cyber-attacks, several of which we shared with you here. On Friday, AT&T (T) said it suffered another massive hack of customer data separate from one reported earlier this year, a reminder of cybersecurity’s place in corporate budgets even as companies spend on AI. We continue to think all investors should have exposure to cybersecurity, especially as bad actors harness the power of AI in their attacks. We like the diversified exposure we have with the CIBR ETF. As holdings of this ETF report their quarterly results in the coming weeks, we’ll revisit our current $62 target. While we are interested in expanding the portfolio’s CIBR position size, we aren’t willing to chase the shares of this ETF to do so, especially after their high single-digit move over the last five weeks.
1-Wk. Price Change: 0.3%; Yield: 0.0%
INVESTMENT THESIS: The First Trust Nasdaq Cybersecurity ETF seeks investment results that correspond generally to the price and yield (before the fund's fees and expenses) of an equity index called the Nasdaq CTA Cybersecurity Index. The Nasdaq CTA Cybersecurity Index is designed to track the performance of companies engaged in the cybersecurity segment of the technology and industrial sectors. It includes companies primarily involved in the building, implementation, and management of security protocols applied to private and public networks, computers, and mobile devices to protect the integrity of data and network operations. To be included in the index, a security must be listed on an index-eligible global stock exchange and classified as a cybersecurity company as determined by the Consumer Technology Association. Each security must have a worldwide market capitalization of $250 million, have a minimum three-month average daily dollar trading volume of $1 million, and have a minimum free float of 20%.
Target Price: Reiterate $62; Rating: Two
Panic Point: Reiterate $48
RISKS: Cybersecurity spending, technology, and product development, the timing of product sales cycle, new products, and services in response to rapid technological changes and market developments as well as evolving security threats.
Labcorp Holdings Inc. LH ; $206.17; 610 shares; 2.76%; Sector: Healthcare
WEEKLY UPDATE: Labcorp LH is trading in a tight range here and still trying to establish a bottom around the $192 area. If that level is tested and holds one more time (as in late May) we can firmly say that is a firm bottom. But until then the stock remains rangebound, capped at $212 with downside at the aforementioned $192. The chart is starting to show improvement in the technical indicators and better turnover on the up days. This week, Baird maintained an outperform on LH but raised its price target to $261 from $258, a modest boost, based on what it sees ahead in 2025. Labcorp will report its next earnings on August 1.
1-Wk. Price Change: 0.8%; Yield: 1.4%
INVESTMENT THESIS: Labcorp is a global leader in innovative and comprehensive laboratory services that provides vital information to help doctors, hospitals, pharmaceutical companies, researchers, and patients make clear and confident decisions. By leveraging its diagnostics and drug development capabilities, the company provides insights and accelerates innovations to improve health and improve lives. The Company is organized under two segments, consisting of Diagnostics Laboratories (Dx), which includes routine testing and specialty/esoteric testing, and Biopharma Laboratory Services (BLS), consisting of Early Development Research Laboratories and Central Laboratory Services. Our attraction to LH shares stems from the combination of the aging population driving diagnostic testing growth and the increasing array of diagnostic testing as well. That combination is expected to drive the healthcare testing services market to $12.6 billion by 2029, from $7.4 billion in 2024, according to Markets and Markets. To augment its position in oncology, women's health, autoimmune diseases, and neurology, the company has been expanding through acquisitions and partnerships with health systems and regional local labs.
Target Price: Reiterate $235; Rating: Two
Panic Point: Reiterate $170
RISKS: Macroeconomic factors, changes in healthcare reimbursement models and products, government regulations, product discontinuations or recalls.
Lockheed Martin Corp. LMT; $463.73; 330 shares; 3.32%; Sector: Aerospace & Defense
WEEKLY UPDATE: Shares of Lockheed Martin have been traveling in a range for the better part of three months, continuing to find support around the $450-$455 area. Much of that is due to the holding pattern we’ve been in, waiting for the resumption of F-35 deliveries. That range has been tested a few times recently, and large volume bars on those days tell us the big institutional buyer is coming in at those levels. That is positive. Reports indicate Lockheed is set to resume F-35 deliveries to the Pentagon next week, and we will look for confirmation for that potential share catalyst. During the week, Goldman Sachs adjusted its price target to $387 from $278, and Lockheed received its latest contract win totaling $251.48 million tied to an Army contract modification. We will continue to monitor geopolitical tensions and the U.S.’s willingness to deliver additional weapons to its allies as well as non-U.S. defense spending. Lockheed will report earnings on July 23.
1-Wk. Price Change: 0.3%; Yield: 2.7%
INVESTMENT THESIS: Lockheed Martin is the largest defense contractor globally and has dominated the Western market for high-end fighter aircraft since the F-35 program was awarded in 2001. Lockheed's largest segment is aeronautics, which is dominated by the massive F-35 program. Lockheed's remaining segments are rotary and mission systems, which is mainly the Sikorsky helicopter business; missiles and fire control, which creates missiles and missile defense systems; and space systems, which produces satellites and receives equity income from the United Launch Alliance joint venture. Historically, the stability of defense spending has been a haven during periods of economic uncertainty, and we see that repeating once again even as geopolitical conflicts are likely to lead to incremental demand for Lockheed's products. The company has increased its dividend consistently over the last 19 years and is widely expected to boost it again in the coming days. In October 2022, Lockheed announced its board authorized the purchase of up to an additional $14.0 billion of LMT stock under its share-repurchase program.
Target Price: $520; Rating: Two
Panic Point: $385
RISKS: Contracts and budget risk with the U.S. government and the Department of Defense, F-35 program funding and renewal, competition, and subcontractor issues.
Mastercard MA; $440.07; 275 shares; 2.64%; Sector: Info. Tech
WEEKLY UPDATE: Like many other stocks outside of Big Tech, shares of Mastercard have been trading in a range over the last 10-12 weeks. That reflects concerns over consumer spending versus prospects for rate cuts and the subsequent impact on consumer borrowings. Data continue to point to real wage growth, which bodes well for consumer spending prospects especially if consumer-facing inflation continues to fall like we saw in this week’s June CPI report. This week, BofA downgraded Visa (V) and Mastercard shares to Neutral from Buy but kept its $480 price target on MA shares. That’s a tad below our price target, and our focus will be if Mastercard can revise its bottom-line expectations higher for H2 2024. One potential swing factor could be tied to what Mastercard says about its gestating China JV, and when that starts to have an impact on its P&L. Should we see an uptick in corporate layoffs and a dramatic slowdown in job creation, it would give us reason to revisit MA’s place in the portfolio.
1-Wk. Price Change: -2.1%; Yield: 0.6%
INVESTMENT THESIS: Mastercard is a card network company that benefits from the secular shift away from cash transactions and toward card-based and electronic payments. On Covid-19 dynamics, we view MA as a "reopening" play and an economic recovery play within technology because its cross-border volumes fell sharply during the pandemic but will rebound as mobility increases and travel restrictions ease. Mastercard has more international exposure relative to Visa (V), making its growth outlook more susceptible to new travel restrictions. However, we view MA as the better long-term play as we are betting on that inevitable recovery.
Target Price: Reiterate $490; Rating: Two
Panic Point: $400
RISKS: The recovery in cross-border transactions, regulation in the payments market, competition from other fintechs, and pricing pressures.
Microsoft Corp. MSFT; $453.55; 377 shares; 3.72%; Sector: Technology
WEEKLY UPDATE: It was a bit of a challenging week for Microsoft MSFT. After gaining ground in late June, the stock ticked to an all-time high last week but has since come down for a modest correction. The good news is an area of good support was not breached. The 20-day moving average has served as a strong area of support and has often provided a nice lift. We are seeing that unfold yet again, and from a technical perspective, we will be looking for a follow-through next week. In the news, the company made a 1.5-billion-dollar investment in a UAE firm (Arab Emirates) with China ties that has raised some concerns with lawmakers. BMO Capital raised its price target on MSFT to $500 from $465 and is keeping an Outperform rating. We are also reading Microsoft may increase its Xbox game pass subscription fees ahead of the new Call of Duty game debut. Microsoft will report earnings on July 25 after the close and in that report, we will be interested in its capital spending plans and what they could mean for our Nvidia and Marvell holdings. We’ll also be interested in its comments on Windows 11, and what that means for the rebounding PC market.
1-Wk. Price Change: -3.0%; Yield: 0.7%
INVESTMENT THESIS: We believe the cloud to be a secular growth trend and that upside to the shares will result from Microsoft's hybrid cloud leadership as the company grabs market share in this expanding industry. While companies may look to build out multi-cloud environments, Microsoft's Azure offering will be a prime choice thanks to its decision to provide the same "stack" used in the public cloud, to companies for their on-premises data centers. Additionally, we would note that hybrid environments are currently the preference for most companies because they allow them to maintain critical data in-house while taking advantage of the agility and scalability provided by public clouds. Outside of the cloud opportunity, we maintain a positive view on the company's growing gaming business, which we believe is becoming an increasingly prominent factor in the Microsoft growth story as gaming becomes more mainstream, management works to convert its gaming revenue from one-time license purchase to a recurring subscription model and as technologies like augmented/virtual reality evolve. Finally, as it relates to LinkedIn and other subscription-based services such as O365 and various Dynamics products, we continue to value them highly for their recurring revenue streams, which, we remind members, provide for greater transparency of future earnings.
Target Price: $480; Rating: Two
Panic Point: Reiterate $380
RISKS: Slowdown in IT spending, competition, cannibalization of on-premises business by the cloud.
Morgan Stanley MS; $104.09; 1,575 shares; 3.60%; Sector: Financial Services
WEEKLY UPDATE: We recently boosted our MS price target to $110 following the post-Fed stress test dividend increase announced by the company. Ahead of Morgan Stanley reporting its quarterly results on July 16, the blitz of bank earnings on Friday, including those from JPMorgan (JPM), provided clear support for our MS thesis. Those bank reports confirmed a surge in investment banking revenue as well as wealth management revenue, which bodes very well for Morgan Stanley’s results. Ahead of that report, we will give another read-through of Friday's earnings conference calls from JPM, Citi, and others, as well as those for Goldman Sachs, on Monday, we’ll be focused on their comments for H2 2024, especially for M&A and IPO activity. To that, we’ll add what we dissect in earnings and guidance from Morgan Stanley and Bank of America on Tuesday, revisiting our MS price target as needed. During the week, UBS and Evercore both lifted their MS targets to $105 from $100 and $102, respectively.
1-Wk. Price Change: 4.5%; Yield: 3.3%
INVESTMENT THESIS: Morgan Stanley reports in three business segments: Institutional Securities (42% of trailing 12-month revenue, 38% of trailing 12-month Income Before Tax), Wealth Management (48%, 55%) and Investment Management (10%, 6%). While the IPO window has yet to reopen, the potential IPO class for 2024 continues to build with recent additions including Panera Bread, Reddit, Fanatics, and Skims, which is backed by Kim Kardashian. This along with the Fed increasingly likely to start cutting rates in H1 2024, suggests we are far closer to the IPO window opening on a sustained basis than we have been in some time. That would be a boon to private equity firms and others that have been nursing IPO candidates during the dark period and a positive for Morgan's investment banking business. Marginally lower rates could also generate a pick-up in M&A activity as the cost of capital with rates improving. As the Fed continues its cutting cycle to get rates back to normalized levels, that effort would also reduce rates for stock market alternatives, ones that quashed the "there is no alternative" trade earlier this year. That along with folks continuing to be behind in retirement savings bodes well for Morgan's wealth management business in the coming quarters.
Target Price: $110; Rating Two
Panic Point: $83
RISKS: Market and interest rate risk, credit risk, country risk, and operational risk, including cybersecurity.
PepsiCo Inc. PEP; $166.38; 800 shares; 2.91%; Sector: Consumer Defensive
WEEKLY UPDATE: On Thursday, this beverage and snacking company reported mixed quarterly results, but as we discussed in our Alert to members, the outlook for H2 2024 calls for significantly stronger EPS growth compared to the S&P 500. Management will make some segment changes in response to some price sensitivity that’s developed in the marketplace. In the face of that, what’s allowing PepsiCo PEP to still deliver revenue and margin gains are further productivity improvements and share further growth in the higher margin international business but also the accelerating rebound in the company’s Quaker business. That combination means PepsiCo has levers to pull that should allow it to compete for consumer wallet share but continue to drive margin and EPS growth. While it may be tempting to add to PEP shares, we will wait until we hear about Coca-Cola (KO), Keurig Dr Pepper (KDP), Utz (UTZ), and others. If that chorus of companies signals that, like PepsiCo, they are more focused on margins and profitability than market share, that may give us the all-clear to bring some additional PEP shares into the portfolio. While we are keeping our $185 price target, on Friday, Goldman Sachs reiterated its $195 target and Buy rating for PEP shares.
1-Wk. Price Change: 1.2%; Yield: 3.3%
INVESTMENT THESIS: PepsiCo is one of the largest food-and-beverage companies globally. It makes, markets, and sells a slew of brands across the beverage and snack categories, including Pepsi, Mountain Dew, Gatorade, Doritos, Lays, and Ruffles. The firm uses a largely integrated go-to-market model, though it does leverage third-party bottlers, contract manufacturers, and distributors in certain markets. In addition to company-owned trademarks, Pepsi manufactures and distributes other brands through partnerships and joint ventures with companies such as Starbucks. The combination of the consumable nature of those products along with PepsiCo's ability to realize price increases has led to consistent revenue, EPS, and dividend growth during both the Great Recession and the Covid pandemic.
Target Price: Reiterate $185; Rating: Two
Panic Point: $148
RISKS: Economic conditions, supply chain constraints, raw material costs.
Qualcomm Inc. QCOM ; $202.43; 890 shares; 3.95%; Sector: Technology
WEEKLY UPDATE: On Wednesday, Taiwan Semiconductor reported its June quarter revenue rose 40% year over year, a positive for Qualcomm’s QCOM business and our shares because TSM’s second largest end market is smartphones. On the same day, findings from research firm Canalys showed the PC market rebound continued in the June quarter. Canalys also shared it sees that rebound accelerating in the coming year in part due to AI PCs, another positive for Qualcomm. That combination led us to boost our QCOM price target to $255 from $240 on Thursday. Shortly thereafter, reports indicate Apple expects to ship 90 million iPhone units in H2 2024, up 11% compared to iPhone 15-unit shipments in 2H 2023. That along with refreshed models announced at Samsung’s Unpacked event this week, bolsters our confidence in a strong 2H 2024 for Qualcomm. Late in the week, KeyBanc raised the firm's price target on Qualcomm to $225 from $205 and kept an Overweight rating on the shares. The next catalysts we will be eyeing for QCOM shares include TSM’s quarterly results next week, and the upcoming reports from Samsung, Apple, and others tied to the smartphone market.
1-Wk. Price Change: -1.6%; Yield: 1.7%
INVESTMENT THESIS: Qualcomm focuses on foundational technologies for the wireless industry, including 3G (third generation), 4G (fourth generation), and 5G (fifth generation) wireless technologies and processor technologies including high-performance, low-power computing, and on-device artificial intelligence technologies. As a connected processor company, its technology roadmap aims to enable the connected intelligent edge (the next generation of smart devices) across industries and applications beyond handsets, including automotive and the Internet of Things (IoT). Qualcomm has three reportable segments: QCT (Qualcomm CDMA Technologies) semiconductor business, which develops and supplies integrated circuits and system software based on 3G/4G/5G and other technologies for use in mobile devices; automotive systems for connectivity, digital cockpit, and ADAS/AD; and IoT including consumer electronic devices; industrial devices; and edge networking products. QCT accounts for 80%-85% of revenue. QTL (Qualcomm Technology Licensing) licensing business grants licenses or otherwise provides rights to use portions of the company's intellectual property portfolio, which includes certain patent rights essential to and/or useful in the manufacture and sale of certain wireless products. QTL accounts for ~15% of Qualcomm's revenue but contributes a greater portion of the company's operating income.
Target Price: $255; Rating Two
Panic Point: $175
RISKS: Customer risk, technology advancement, competition risk, third-party supplier, and manufacturing partner risk.
SPDR Gold Shares ETF GLD ; $223.11; 238 shares; 1.16%; Sector: Commodities
WEEKLY UPDATE: What a move for gold this week. Even after a better-than-expected CPI number, the yellow metal burst higher with a move above $2,400 per ounce. That puts gold within striking distance of the all-time highs, and GLD highs near $226 are not far off. If inflation seems to be falling as indicated by recent CPI data, then why would gold be strong? That’s a good question, but with so much money moving around to different areas on Thursday from large to small caps, the gold miners and gold stocks received some money flows. In addition, lower rates often correlate well with higher metal prices, and we have seen gold surge when yields drop. Gold may also be responding to continued turmoil in the Middle East battle as well as the Russia/Ukraine conflict. Lastly, a potential pivot in Fed policy if inflation continues down may cause some movement in assets (from equity to fixed income for example) and create some volatility in the markets. Gold is considered a haven in times of stress. As GLD shares move closer to our price target, we’ll be mindful of the cumulative move since late February when shares of this ETF were near $187.50.
1-Wk. Price Change: 1.0%; Yield: 0.0%
INVESTMENT THESIS: The GLD ETF is a proxy for gold. This "trust" buys and sells gold futures each day to mimic the daily moves in the underlying asset, in this case, gold. We see gold as an ideal hedge against a weaker dollar, strong inflation (which tends to weaken the dollar) alternative, and in uncertain times (worry over war and battles). For the past 15 years, gold has been a strong asset class held by fund managers, countries, and banks. The metal is not correlated with markets and will move based on the demand/supply dynamic in the marketplace. Other precious metals such as silver and platinum are good proxies for the criteria stated earlier, however, gold is far more liquid and offers better upside opportunities.
Target Price: Reiterate $230; Rating: Two
Panic Point: $190
RISKS: Weak inflation data, interest rate risk, dollar strength relative to other currencies, geographic risk.
ServiceNow NOW ; $758.49; 66 shares; 1.09%; Sector: Technology
WEEKLY UPDATE: After performing like a champ since we initiated a starter position, NOW shares were under pressure this week following a downgrade at Guggenheim. While we disagreed with several of the firm’s points, we recognize AI-related expectations are running high, and given the move in NOW shares, the company will have to deliver a pristine quarter and stronger-than-expected outlook when it reports on July 24, 2024. Between now and then, we will have a few hundred companies report and what they say about AI spending will matter. If the overwhelming message is that they are spending on AI, it will add further support for our thesis on NOW shares. On the other hand, if the start of the June-quarter earnings season leaves folks wanting, we could see the market repeat the more than 4% pullback experienced in mid-April. While we would love to buy more NOW shares much closer to our $662.65 cost basis, the odds of that are likely low. We would be interested in picking up more NOW shares closer to the $732 level and we would be more aggressive if they approached the 200-day moving average near $704.
1-Wk. Price Change: 5.5%; Yield: 0.0%
INVESTMENT THESIS: The addition of ServiceNow adds exposure to the enterprise as it deploys AI-enabled solutions across its enterprise workflow platform. The company’s “Now Platform” is a cloud-based solution with embedded AI and machine learning (ML) capabilities that help unify and digitize workflows, driving productivity. At the heart of it, the company’s platform automates workflows across an entire enterprise by connecting disparate departments, systems, and silos in a seamless way to unlock productivity. ServiceNow counts more than 8,100 global customers, including 85% of the Fortune 500, with 97% of its revenue from subscriptions that have notched a 98% renewal rate.
Target Price: Reiterate $840; Rating: Two
Panic Point: $585
Waste Management WM ; $213.75; 530 shares; 2.47%; Sector: Industrials
WEEKLY UPDATE: The May Construction Spending report was constructive for Waste Management’s WM non-residential business, which has multiple stimulus programs out of Washington and growing electric power demands. Meanwhile, we continue to favor the sticky residential business, especially because of further margin-improvement prospects as Waste expands its use of automated trucks. During the company’s earnings call on July 24, we expect to hear more about the company’s acquisition of medical waste company Stericycle, including its integration plans and how it can bring margins up to Waste’s levels. We also expect an update on reported efforts by Waste to sell its renewable natural gas business which has an estimated worth near $3 billion.
1-Wk. Price Change: 1.6%; Yield: 1.4%
INVESTMENT THESIS: 2024 will see more nonresidential construction activity because of the Biden Infrastructure Law, but now we can finally factor in activity for the CHIPS Act, which saw its first award this week. Other potential drivers include spending associated with the Inflation Reduction Act, including the much-awaited start of building out a nationwide network of EV charging stations. Recently President Biden announced an $8.2 billion passenger rail project, which will likely take several quarters to come onstream, leading us to think it's more of a 2025 catalyst. Alongside that bright outlook for WM's commercial business, automation efforts and pricing power in its sticky residential business should drive margins and EPS generation higher in the coming quarters.
Target Price: Reiterate $230; Rating: Two
Panic Point: $178
RISKS: Industry and economic risk, competition and competitive pressures, and acquisition risk.
