Chart of the Day: Costco's Dip May Soon Be Worth Buying
Costco has gained more than 100% since being added to TheStreet Pro portfolio.
You've reached your free article limit
You've read 0 of 1 free Pro articles.
Costco Wholesale COST is one of our favorite portfolio names. It has been a stalwart winner during good times and bad, always moving from the bottom left to the upper right on the chart.
Costco has gained more than 100% since we added it to TheStreet Pro portfolio — a fantastic move. However, there are times when the stock is going to show some weakness, and those have usually been great buying opportunities.
Thursday we see the stock getting hammered on a "sell the news" response to their price raise on membership. This could be just another chance to add shares on the cheap.
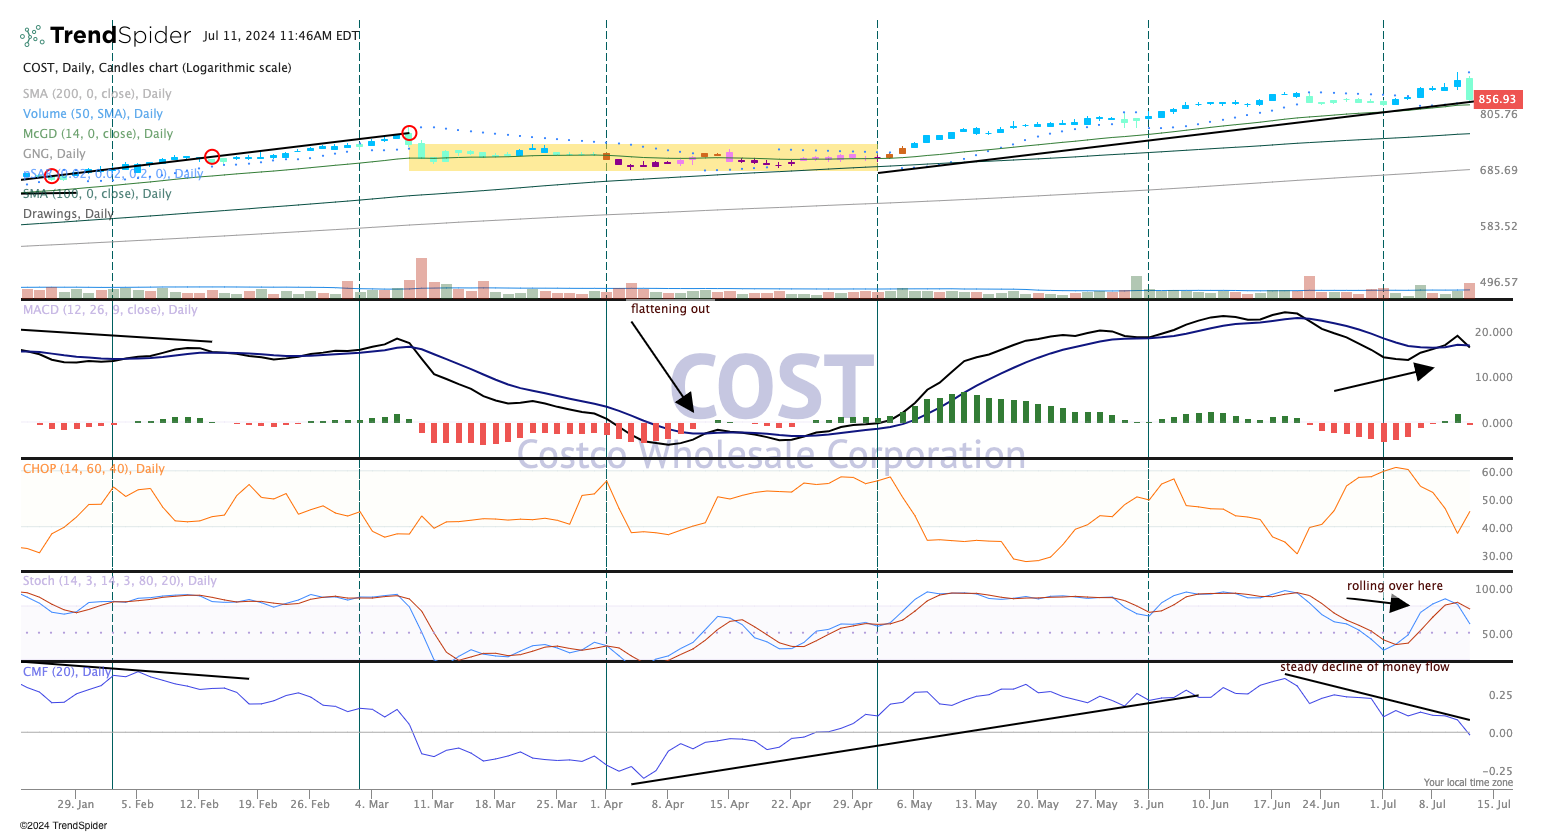
Costco's technicals have been strong for awhile and even as the stock is hit hard the candles still reflect a cautiously bullish trend (teal). Moving Average Convergence Divergence (MACD) is rolling over but money flow at the bottom is significantly weak right here and has been for a month. This tells us big money is taking some profits and waiting to re-enter at lower prices.
So, do you buy this first dip? That is not advisable, but let's watch this and see how far down the stock drops. There is strong support at the 50-day moving average ($820) and then down to $780.
We rate Costco a Two in TheStreet Pro portfolio.
At the time of publication, TheStreet Pro Portfolio is long COST.
