Monthly Roundup: November Shaping Up Good for Market, Even Better for Portfolio
While year-end talk grows, we’re more focused on the coming quarters.
You've reached your free article limit
You've read 0 of 1 free Pro articles.
Following Fed Chair Powell throwing some cold water on the stock market’s November move higher late last week, this week the market resumed its move higher. The Volatility Index (VIX) moved lower while the yield on the 10-year Treasury inched lower compared to its mid-month peak. The continued climb in the S&P 500 has it trading just under 25x expected 2024 EPS of $240.09, a small distance from the 25.1x it peaked at on November 11.
While frothy, when we look at the S&P 500’s relative strength index (RSI) level, at just over 70, it has yet to return to overbought status. Looking at the Fear & Greed Index, it's comfortably in "Greed" territory closing out the week. With that in mind, as we think about the S&P 500’s multiple, it likely reflects high expectations for the Trump administration to deliver policy that will stoke the economy, roll back regulation, and extend the 2017 tax cuts. This suggests the expectation for the basket of S&P 500 companies to deliver more EPS growth next year than the 14.6% implied by the 2025 S&P 500 consensus EPS of $275.16 is high.
Yet as we saw this week between quarterly results from Walmart WMT and Target TGT, not all companies in a given sector are performing at the same level. This supports our view to be selective investors, focusing on companies with stronger EPS prospects and multi-year tailwinds blowing on their businesses.
As we move through the upcoming mini-wave of December investor conferences, we’ll be listening for management comments about the coming year so we can get an early read on how viable current 2025 consensus EPS expectations are for the S&P 500. Typically, companies formally unveil their forward guidance for the coming year in January and early February. We’ll aim to get ahead of that as best we can.
Outside of 2025 EPS growth prospects for the S&P 500 and what it means for the market’s valuation, the other item on the market’s mind is the cadence of Fed rate cuts over the coming quarters. In response to Fed Chair Powell’s sobering comments last week, the market has adopted a much more conservative view on the possibility of a December rate cut.
According to the CME FedWatch Tool, the market now sees a 52.7% probability the Fed will deliver another 25-basis point rate cut on December 18, down from an almost 70% probability a month ago. Looking out toward the end of 2025, the CME FedWatch Tool shows an almost even probability between a total of three and four rate cuts between now and December 2025.
Friday’s November Flash PMI data painted a favorable picture of the economy and renewed progress on inflation toward the Fed’s 2% target. When it came to job creation during November, the report showed further softening, and that bad news is viewed as a favorable development for rate-cut prospects. We do, however, have several pieces of November data coming in early December, and what they reveal about the speed of the economy, inflation, and the employment market will signal when the Fed may cut rates again.
As you can see, with less than 25 trading days before we close out 2025, there are several forces that will shape the market’s movement in the coming weeks. To that, we can add what next week’s Black Friday to Cyber Monday shopping weekend says about consumers and the 2024 holiday shopping season. To prepare for that, we’ll be turning over retailer earnings next week looking to see if the aggregate view is closer to the upbeat one issued by Walmart or a more dire like Target’s call for flat comp sales for the current quarter.
For some, when the finish line comes into view, the temptation is to coast. While year-end is viewed as a finish line by many, we understand the moves we’ve made and the ones we may make in the next few weeks will be the ones that position us for the coming quarters. In other words, there will be no coasting here at the TheStreet Pro Portfolio. We’ll keep our sleeves rolled up, and nose to the grindstone as we continue to do the work and share our findings and portfolio moves with you.
Catching Up on the Portfolio This Week
As the market recovered some of the ground it lost the prior week, we saw a number of our holdings, such as Applied Materials AMAT, The Trade Desk TTD, and Waste Management WM, recover, and several, such as Dutch Bros BROS, Costco COST, ServiceNow NOW, and Elastic ESTC, power ahead. Those and other moves allowed the portfolio to widen its lead against the S&P 500 on a year-to-date basis.
On Wednesday, we scooped up more shares of Universal Display OLED, and then on Thursday we made a similar move with Applied Materials, PepsiCo PEP, and Qualcomm QCOM. Later on Thursday, we noted we are keeping a close eye on shares of Lockheed Martin LMT as well as others on our shopping list, which include Alphabet GOOGL, Meta META, and Microsoft MSFT. Those three Big Tech holdings have been a drag on the portfolio quarter to date, but we continue to see them benefiting from AI adoption as well as the ongoing shift to digital advertising.
The week’s buying complemented the register ringing we did earlier in November when we exited our very profitable position in Axon Enterprise AXON and cashed in some big gains following the recent short squeeze in Dutch Bros shares. Other moves we made in early November include some prudent portfolio management with Bank of America BAC, Marvell MRVL, and Morgan Stanley MS shares as well as some small buying in Meta, Lockheed Martin, Builders FirstSource BLDR, Waste Management, and Universal Display.
Kicking all of that off was the November 1 decision to close out the portfolio’s position in ProShares Short S&P500 ETF SH following the October Employment Report. Given the S&P 500’s November gain, that action stemmed any major losses we would have incurred.
The combined actions over the last 16 trading days put our cash position in the portfolio at just over 11% of its assets. We will continue to look for opportunities both in and out of the portfolio as we navigate the coming weeks. We will continue to focus on companies with superior EPS prospects, pronounced tailwinds in their businesses, and entry points that skew favorably from a risk-to-reward perspective. The goal will be to build on our success and position the portfolio for the coming quarters.
This Week's Portfolio Videos
We cover a lot of ground during the week in our Daily Rundowns. If you happened to miss one or more of them, here are some helpful links:
Monday, November 18: Four Shopping List Stocks We’re Watching
Tuesday, November 19: Walmart Earnings Solidify Our Price Target Boost for This Holding
Wednesday, November 20: Our Plan if Nvidia Earnings Fall Short
Friday, November 22: Here's the Plan as a Big Tech Holding Sits on Our Pick-Up Level
Key Global Economic Readings
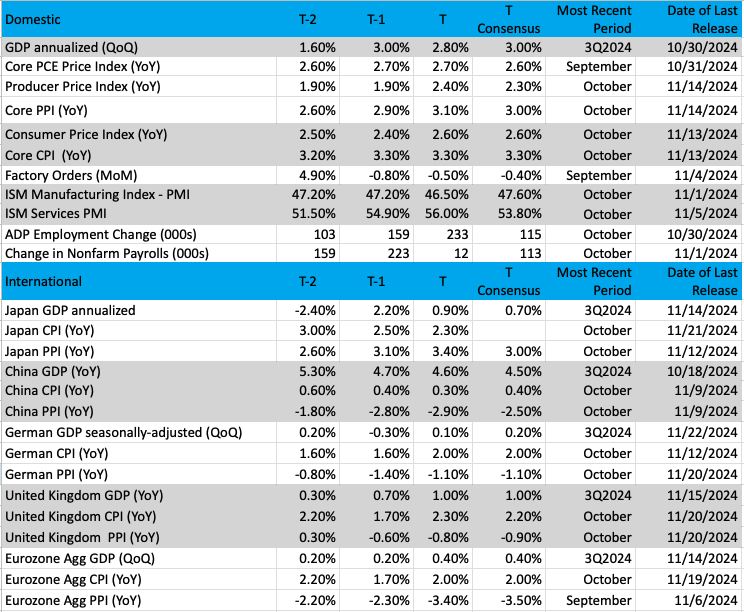
(Note: T is the most recent period, T-1 is the prior period's reading and T-2 is two periods back, the intent being to illustrate any trends)
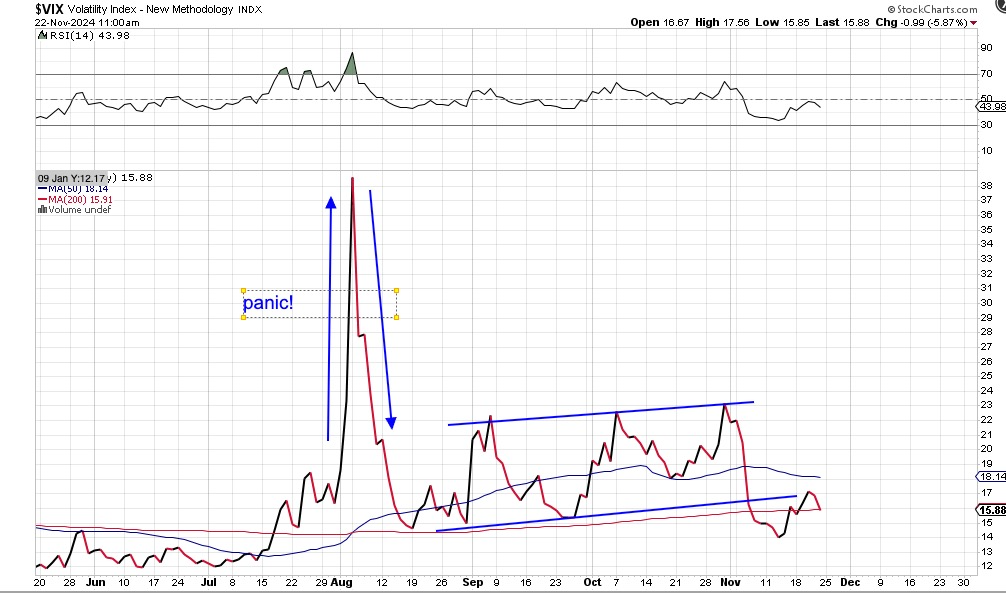
Chart of the Week: The Volatility Index (VIX)
As we move into the holiday trading season, we must ask if market volatility is going to hibernate until the new year begins or will worries and nervousness make investors crazy and hit the sell button. Looking back historically the period between Thanksgiving and New Year’s has little to no volatility.
Now, that does not mean the markets won’t move, but it does mean whipsaw up-and-down moves are not likely to happen. We measure market movements by using the Volatility Index (VIX), which is an instrument that shows when investors and traders are showing the most (and least) fear.
The VIX oscillates each day depending on the mood of the market. When the VIX is trending down it means there is less fear and volatility in the markets. Most investors and traders appreciate a calm environment without many fireworks or blowups, which makes it much more palatable to risk our capital.
Looking at the chart, below, we see the VIX is trending down currently. No surprise of course as during this seasonally bullish period the VIX tends to get smashed down. Further, what investors would like to see is the VIX stay down, not become jumpy as it did this past August, where we saw panic ensue.
Even oscillating between 16-23 is a bit unnerving for investors, but a range of 12-16 might be much more appealing for the bulls as we may see better price action and money flows into the market, in a perceived "safer" environment.
Other charts we shared with you this week were:
Monday, November 18: S&P 500 - We Might Be in Correction Territory, But ..
Monday, November 18: Mastercard (MA) – Mastercard = Master Chart
Tuesday, November 19: Builders FirstSource (BLDR) - This Holding Is Finding Support Where It Should
Wednesday, November 20: Elastic NV (ESTC) - Some Bullish Qualities, But...
Thursday, November 21: Costco (COST) - This 'Powerfully Bullish Chart' Sends a Clear Message
The Week Ahead
We have a compressed trading week ahead for U.S. equities owing to the Thanksgiving holiday that will have those markets closed on Thursday, November 28, followed by an early market close on Friday, November 29. While we will get a few more pieces of October housing data and the Fed’s November FOMC policy meeting minutes, given recent Fed official comments that have been more cautious about Fed rate-cut prospects we expect the market will focus most on Wednesday’s October PCE Price Index data. Should it come in warmer than expected like we saw with the October CPI and PPI data, it would be another reason for the market to reconsider the likelihood of a December rate cut.
As folks digest their holiday meal, attention will turn to the four-day holiday shopping bonanza that spans Black Friday (November 29) to Cyber Monday (December 2). We’ll collect those figures as they are reported and break them all down for you starting December 2.
Here's a closer look at the economic data coming at us next week:
U.S.
Tuesday, November 26
· FHFA Housing Price Index – September (9:00 AM ET)
· S&P Case-Schiller Home Price Index – September (9:00 AM ET)
· Consumer Confidence – November (10:00 AM ET)
· New Home Sales – November (10:00 AM ET)
· FOMC Meeting Minutes – 2 PM ET
Wednesday, November 27
· MBA Mortgage Applications Index – Weekly (7:00 AM ET)
· Personal Income & Spending, PCE Price Index – October (8:30 AM ET)
· Initial & Continuing Jobless Claims – Weekly (8:30 AM ET)
· Durable Orders – October (8:30 AM ET)
· GDP (2nd estimate) – 3Q 2024 (8:30 AM ET)
· Pending Home Sales – October (10:00 AM ET)
· EIA Crude Oil Inventories – Weekly (10:30 AM ET)
· EIA Natural Gas Inventories – Weekly (10:30 AM ET)
Thursday, November 28
· US equity markets closed for the Thanksgiving holiday
Friday, November 29
· US equity markets close at 1 PM ET
International
Monday, November 25
· Germany: Ifo Business Climate Index
Wednesday, November 27
· China: Industrial Profits – October
· Germany: GfK Consumer Confidence - December
· Eurozone: ECB Non-Monetary Policy Meeting
Thursday, November 28
· Eurozone: Economic Sentiment & Consumer Confidence – November
· Germany: Inflation Rate (Preliminary) - November
Friday, November 29
· Germany: Retail Sales – October
· Eurozone: Flash Inflation Rate - November
Turning to the companies reporting their quarterly results next week, the list skews heavily toward retailers. Comparing quarterly results and guidance this week from Walmart (WMT) and Target (TGT) confirms shoppers are embracing deals, promotions, and other strategies to maximize their disposable income. The comp sales figures for both confirm larger market-share gains at Costco and we continue to see it as well as Amazon well positioned for the holiday shopping season.
As we review the results and guidance from the likes of Best Buy (BBY), Macy’s (M), Nordstrom (JWN), and others, we’ll refresh our thinking about the consumer and holiday shopping prospects. We will be listening to see if retailers anticipate a greater use of incentives to drive sales, and if that is the message being delivered it means potential downside risk for their margins.
Following Qualcomm’s Investor Day, we’ll look to connect the dots regarding its comments about the AI PC market for the holiday season and into 2024 when Dell (DELL) and HP (HPQ) report next week. We’ll also be interested in their larger comments about AI and AI adoption as it relates to Marvell’s (MRVL) carrier infrastructure and enterprise networking segments.
Here's a closer look at the earnings reports coming at us next week:
Monday, November 25
· Open: Bath & Body Works (BBWI).
· Close: Agilent (A), Zoom Video (ZM).
Tuesday, November 26
· Open: Abercrombie & Fitch (ANF), Best Buy (BBY), Burlington Stores (BURL), Dick’s Sporting Goods (DKS), Kohl’s (KSS), Macy’s (M).
· Close: Ambarella (AMBA), CrowdStrike (CRWD), Dell (DELL), HP (HPQ), Nordstrom (JWN), Urban Outfitters (URBN), Workday (WDAY).
Portfolio Investor Resource Guide
· Economic Data: Here's a List of Links to the Key Economic Data We Closely Watch
· Investing Terminology: 16 Key Terms Club Members Should Know
· 10-Ks: Want to Know About a Stock? Read the Company's Reports
· 10-Qs: Unlock the Numbers and Key Information Behind Your Stock With the 10-Q
· Income Statement: Our Cheat Sheet to Understanding This Financial Document
· Balance Sheet, Cash Flow Statements, and Dividends: How to Know If a Company Is Off-Kilter? Read Its Balance Sheet
· Valuation Metrics: Everyone Wants a Value. Here's How Investors Can Find
· Thematic Investing 101 Webinar
The Portfolio Ratings System
1 - Buy Now (BN): Stocks that look compelling to buy right now.
2 - Stockpile (SP): Positions we would add to on pullbacks or a successful test of technical support levels.
3 - Holding Pattern (HP): Stocks we are holding as we wait for a fresh catalyst to make our next move.
4 - Sell (S): Positions we intend to exit.
ONES
Alphabet GOOGL; $164.76; 1,035 shares; 3.38%; Sector: Communication Services
UPDATE: Shares of Alphabet (GOOGL) were rangebound for most of October but that changed following the company’s across-the-board better-than-expected September-quarter earnings report. However, the shares floundered in recent weeks and moved lower this week following headlines indicating the Justice Department is angling to see the company sell off its Chrome browser as well as other “remedies” it's suggesting following the August 2024 ruling it was illegally maintained a monopoly over online search services. Let’s remember that these are the DoJ’s recommendations. It will be the outcome of the trial slated to start in April, which will be overseen by U.S. District Judge Amit Mehta, that will matter more. While Mehta has communicated an expected decision by August, odds are high that Alphabet will appeal his decision, which means it will be some time until we have a final ruling. Near-term we’ll focus on the drivers of Alphabet’s business and its earnings prospects as we continue to weigh the probabilities of various outcomes and their impact on the company and our shares. As we do that, we will watch key support levels for the shares as we contemplate our next move. Should they break and become oversold that would likely offer a compelling risk-to-reward tradeoff. Because we are still in the relatively early innings when it comes to AI revenue generation, we will be patient with Alphabet and GOOGL shares. We continue to see the company well positioned, given its treasure trove of data across its search, advertising, and YouTube businesses, which should benefit it in the coming months with an upswing in digital advertising. As AI matures, we see that bringing further lift to Google Cloud’s revenue and profit generation. During the September quarter, Alphabet repurchased $15.3 billion in stock, bringing its year-to-date total to $47 billion, leaving nearly $60 billion left under its current buyback program. The company’s next quarterly dividend of $0.20 per share will be paid on December 16 to shareholders of record on December 9.
1-Wk. Price Change: -4.5%; Yield: 0.5%
INVESTMENT THESIS: We believe that while search and digital ad dominance are what will carry shares in the near- to mid-term, longer-term it is the company's artificial intelligence "moat" that will provide for new avenues of growth. AI is what has made the company's search, video, and targeted ad capabilities best-in-class and is the driving force behind the company's success in voice (Google Home) and autonomous driving (Waymo). Furthermore, we believe it is this AI expertise that will also make the company more prevalent in other industries, including healthcare via its subsidiary Verily, as AI and machine learning continue to disrupt operations across industries. Adding to our positive view of the company's future opportunities, we believe that Alphabet's free cash flow generation and solid balance sheet set it apart and are what will allow the company to continue taking chances on far-out ground-breaking and potentially world-changing projects. The company is also preparing to roll out Gemini Subscription with enterprise plans for workspace, according to a report. All good news for Alphabet.
Target Price: Reiterate $210; Rating: One
Panic Point: $145
RISKS: Regulatory risk (data privacy), competition, and macroeconomic slowdown impacting consumers and therefore ad buyer activity.
Amazon AMZN; $197.12; 946 shares; 3.69%; Sector: Consumer Discretionary
UPDATE: Favorable digital shopping metrics in the October Retail Sales report and other data points pointing to consumers leaning into digital shopping have powered Amazon (AMZN) shares higher so far this quarter. We continue to see the company well positioned to capture wallet share this holiday season, which paired with tight expense control should drive further margin gains at the North America and International segments. Accelerating AI and cloud adoption bodes well for Amazon Web Services, a key driver of Amazon’s profits and cash flow. Based on the company’s December-quarter guidance for $181.5 billion-$188.5 billion in revenue, up 7%-11% year over year, it sees operating income in the range of $16 billion-$20 billion. Some quick math puts the quarter’s operating margin between 9% and 11% compared to 11% in the September quarter. Our take is that view is likely conservative. Looking ahead, the benefit of continued cost efficiencies in its fulfillment network and the mix shift toward the higher margin AWS and advertising businesses bode extremely well for higher margins and profit dollars next year compared to this year. Upcoming catalysts include consumer spending tallies for the Black Friday-Cyber Monday shopping weekend and Amazon debuting its Tranium 2 AI chip offering in the coming weeks. The next level of support for Amazon shares is near $193, but we see much stronger support between $184-$187, which are the 100 and 200-day moving averages. During November, AMZN shares were named to JPMorgan’s “Analyst Focus List” with a $250 target.
1-Wk. Price Change: -2.7%; Yield: 0.0%
INVESTMENT THESIS: We believe upside will result from Amazon's continued eCommerce dominance, AWS's continued leadership in the public cloud space, and ongoing growth of the company's advertising revenue stream, which feeds off Amazon's eCommerce business. Additionally, we think profitability will continue to improve as AWS and advertising account for a larger portion of total sales as both these segments sport higher margins than the eCommerce operation. While we believe the increasing share of the revenue from these higher margin businesses will be key to driving profitability longer-term, we think margins on eCommerce stand to improve as the company's infrastructure is further built out and economies of scale further kick in. The embedded call option is that management is always looking to enter a new space and generate new revenue streams.
Target Price: Reiterate $240; Rating: One
Panic Point: $162
RISKS: High valuation exposes the stock to volatile swings, eCommerce has exposure to slower consumer spending and competition, management is not afraid to invest heavily, potential headwinds resulting from new eCommerce regulation in India, and management is not scared to invest aggressively for growth, which can at times cause volatile reactions as near-term concerns arise relating to the impact on margins.
Bank of America Corp. BAC; $47.00; 4,410 shares; 4.10%; Sector: Financial Services
UPDATE: Shares of Bank of America (BAC) had a strong showing in October, but they moved considerably higher following the outcome of the 2024 presidential election and the prospects for a more favorable regulatory environment. That bodes well for BofA and other banks on several fronts including capital requirements and M&A activity. Echoing that thought, this week Goldman Sachs CEO David Solomon called for a pick-up in both equity capital raising and M&A activity under the Trump administration. We continue to see Bank of America’s investment banking and asset/wealth management businesses well positioned as the Fed delivers incremental interest rate cuts over the ensuing quarters. BofA’s efforts to expand its commercial banking footprint should pay dividends as those lower rates boost lending activity. BofA is expected to give initial 2025 net interest income (NII) guidance when it reports December-quarter results in January. Should we see a meaningful pickup in investment banking activity, stock market inflows, or loan activity, we will revisit our BAC price target as needed. If we saw BAC shares retreat to support near $41-$42, it would be a very favorable place for members to add BAC shares.
1-Wk. Price Change: 0.5%; Yield: 2.2%
INVESTMENT THESIS: Bank of America is one of the world's leading financial institutions, serving individual consumers, small and middle-market businesses, and large corporations with a full range of banking, investing, asset management, and other financial and risk management products and services. The company provides unmatched convenience in the United States, serving approximately 67 million consumer and small business clients with approximately 3,900 retail financial centers, approximately 16,000 ATMs, and award-winning digital banking with approximately 56 million verified digital users. Bank of America is a global leader in wealth management, corporate and investment banking, and trading across a broad range of asset classes, serving corporations, governments, institutions, and individuals around the world. Bank of America offers industry-leading support to approximately 3 million small business households through a suite of innovative, easy-to-use online products and services. The company serves clients through operations across the United States, its territories, and approximately 35 countries. From a reporting perspective, the company's business breaks down as follows: Net Interest Income breakdown: Consumer Banking 57%, Global Banking 23%, Global Wealth & Investment Management 14%, and Global Markets 6%; Income Before Tax breakdown: Consumer Banking 42%, Global Banking 27%, Global Wealth & Investment Management 16%, and Global Markets 15%. Bank of America pays a quarterly dividend of $0.22 per share.
Target Price: $51; Rating: One
Panic Point: $38
RISKS: Financial markets, fiscal, monetary, and regulatory policies, economic conditions, and credit ratings.
Builders FirstSource BLDR; $178.52; 825 shares; 2.91%; Sector: Industrials
UPDATE: Shares of Builders FirstSource (BLDR) logged a 40% gain in Q3 2024, benefiting from the decline in the 10-year Treasury yield. However, as that yield rebounded in October even after the Fed’s 50-basis point rate cut, BLDR shares gave back some of those gains in October. The 10-year Treasury yield has inched higher in November following sobering comments from Fed officials about the potential cadence of rate cuts. That net effect has resulted in BLDR shares being a quarter-to-date drag on the portfolio even though the portfolio’s position in the shares is still up more than 17%. When took on BLDR shares, our thesis hinged on the Fed eventually embarking on a rate-cutting cycle that would strengthen housing construction. At the same time, homebuilder focus on margins would be a positive for Builder’s value-added products. That led us to add additional shares in early November following management’s earnings call comment that year to date it repurchased $1.7 billion in stock and remains on track to buy back $5.5 billion to $8.5 billion of stock between 2024-2026. This strongly suggests to us that the company will use this program to help support the shares and could accelerate the program as the expected turn in the housing market picks up steam. With the Fed targeting returning monetary policy to neutral footing over the coming quarters, housing construction activity should rebound, and that leads us to see H2 2025 and 2026 as a vibrant period for Builders FirstSource. The next catalysts for the shares include next week’s October PCE price index data and the final November PMI data that should arrive soon after the Thanksgiving holiday weekend. In the meantime, because we have yet to establish a full BLDR position, we will continue to watch key support levels for the shares.
1-Wk. Price Change: 1.3%; Yield: 0.0%
INVESTMENT THESIS: Builders FirstSource is a supplier and manufacturer of building materials, manufactured components, and construction services to professional homebuilders, sub-contractors, remodelers, and consumers. The company’s top 10 customers account for 15% of net sales and are comprised primarily of the largest national production homebuilders, including publicly traded companies such as D.R. Horton, Dream Finders Homes, Lennar Corp., Pulte, Taylor Morrison Home, and Toll Brothers. The company is leveraging its national manufacturing footprint to grow its higher-margin value-added products as homebuilders look for more efficient ways to construct homes. We see this driving faster revenue and earnings growth in the coming quarters as the eventual rate-cutting cycle by the Fed lifts the demand for housing.
Target Price: $235; Rating: One
Panic Point: $160.
RISKS: Economy, interest rates, commodity pricing, and supply chain risks.
Lockheed Martin Corp. LMT; $542.22; 320 shares; 3.43%; Sector: Aerospace & Defense
UPDATE: Following nice gains and taking some chips off the table in early October near $606, LMT shares sold off following its September-quarter results in mid-October and continued to trend lower over the ensuing weeks. The shares perked up following the 2024 presidential election outcome as we added back some shares near $562. LMT shares then turned lower resulting in their becoming a modest drag on the portfolio’s November-to-date performance. The aerospace giant remains on our shopping list because of the prospect of greater global defense spending ahead. Bloomberg Intelligence finds the 15 largest European members of NATO will need to nearly double their annual military investment to $720 billion to bolster capacity against Russia and offset the possibility of less U.S. support under a Donald Trump presidency. In terms of the president-elect’s defense spending plans, the growing expectation is that military spending will likely remain on its low-single-digit annual percentage gain increase trajectory. However, how that will be impacted by the Department of Government Efficiency remains to be seen. When we have more clarity on that, we’ll assess our next move with LMT shares. Lockheed stands to benefit in the coming quarters due to rising F-35 production, working off a record backlog, rising international defense spending, and the need to re-arm U.S. defense stockpiles. We are inclined to be patient with Lockheed as ramping production volumes drive operating leverage that falls to the bottom line. When Lockheed reports its December-quarter results, it will share an updated multiyear production schedule, which will give us a clear view of what lies ahead. Lockheed’s next quarterly dividend of $3.30 per share will be paid on December 27 to shareholders of record on December 2.
1-Wk. Price Change: 1.4%; Yield: 2.4%
INVESTMENT THESIS: Lockheed Martin is the largest defense contractor globally and has dominated the Western market for high-end fighter aircraft since the F-35 program was awarded in 2001. Lockheed's largest segment is aeronautics, which is dominated by the massive F-35 program. Lockheed's remaining segments are rotary and mission systems, which is mainly the Sikorsky helicopter business; missiles and fire control, which creates missiles and missile defense systems; and space systems, which produces satellites and receives equity income from the United Launch Alliance joint venture. Historically, the stability of defense spending has been a haven during periods of economic uncertainty, and we see that repeating once again even as geopolitical conflicts are likely to lead to incremental demand for Lockheed's products. The company has increased its dividend consistently over the last 19 years and is widely expected to boost it again in the coming days. In October 2022, Lockheed announced its board authorized the purchase of up to an additional $14.0 billion of LMT stock under its share-repurchase program.
Target Price: $650; Rating: One
Panic Point: $515
RISKS: Contracts and budget risk with the U.S. government and the Department of Defense, F-35 program funding and renewal, competition, and subcontractor issues.
Marvell Technology MRVL; $92.51; 2,157 shares; 3.94%; Sector: Technology
UPDATE: Coming off their strong move in October, shares of Marvell (MRVL) continued to climb in November, bringing their quarter-to-date return to more than 25%. Fueling the ascent was the growing number of comments and data points for AI adoption and chip demand. Those comments included blowout October revenue from Taiwan Semiconductor, Hon Hai and Ericsson, confirming our view AI adoption will chew through existing network capacity, as well as more recent ones from Alphabet, IBM, ServiceNow, Microsoft, Digital Realty Trust, Cisco and of course on Nvidia. That strength in MRVL led us to some prudent portfolio management in early November as we contended with MRVL becoming a bloated position size and locked in a sizable triple-digit gain on that slice of shares. Findings from Menlo Ventures show enterprise spending on AI increased sixfold in 2024 as companies began implementing AI after first experimenting with it. More telling is that 72% of enterprise IT decision-makers from companies with 50 or more employees expect to see broader adoption of AI “in the near term.” That supports comments from Cisco and others that we are still in the relatively early innings of AI adoption. As that continues across the enterprise and consumer-facing devices, including PCs, smartphones, and other connected devices, we continue to see the need for additional data center, enterprise networking, and communications infrastructure capacity. This keeps us bullish on MRVL shares as does the company’s ramping proprietary AI chip business with Amazon, Microsoft, Alphabet, and Meta. Amazon’s Tranium 2 silicon is expected to be released later this year, and we believe that bodes well for Marvell’s earnings report on December 3. We see our MRVL thesis playing out over several quarters, and we are inclined to be long-term holders of the shares.
1-Wk. Price Change: 5.3%; Yield: 0.3%
INVESTMENT THESIS: Marvell is a fabless supplier of high-performance standard and semi-custom infrastructure semiconductor solutions. These solutions power the data economy, enabling the data center, carrier infrastructure, enterprise networking, consumer, and automotive/industrial end markets. With roughly 75%-80% of Marvell's revenue stream tied to digital infrastructure, we see it continuing to benefit from rising content consumption and creation. Pointing to that rising demand that necessitates network densification and the build of digital infrastructure, Ericsson sees global monthly average usage per smartphone reach 46 gigabytes (GB) by the end of 2028 vs. 19 GB in 2023 and 15 GB in 2022.
Target Price: Reiterate $105; Rating: One
Panic Point: $68
RISKS: Technology risk, customer risk, competition risk, reliance on manufacturing partners, and supply chain constraints.
Nvidia Corp. NVDA; $141.95; 1,510 shares; 4.24%; Sector: Technology
UPDATE: August, September, and October were strong months for Nvidia shares and that trend continued in November, bringing the gain on the portfolio’s shares to more than 75% since we initiated the position in early February. Leading up to Nvidia’s quarterly results this week the growing number of data points, including ones from Taiwan Semi and Foxconn, about AI adoption and chip demand fueled their ascent. Ahead of the company’s earnings report, we shared the risk that market expectations would be extreme given the cumulative move in NVDA shares since their August low. Nvidia delivered stellar October-quarter results and impressive guidance, but as we suspected, as strong as its outlook was for the current quarter, it fell short of more aggressive Wall Street expectations. In our note to members, we explained why we maintained our $175 price target even as others across Wall Street were lifting their targets in and around ours. Findings from Menlo Ventures show enterprise spending on AI increased sixfold in 2024 as companies began implementing AI after first experimenting with it. More telling is that 72% of enterprise IT decision-makers from companies with 50 or more employees expect to see broader adoption of AI “in the near term.” That supports comments from Cisco and others that we are still in the relatively early innings of AI adoption. The next catalysts for us to watch for Nvidia will be the company’s presentation at the UBS Global Technology and AI Conference on December 3, Taiwan Semi’s November revenue report in early December, and Nvidia CEO Jensen Huang’s keynote at 2025 CES on January 6. As we digest those events, we’ll revisit our $175 price target as needed. Given the current upside to our price target, we reiterate our One rating on NVDA.
1-Wk. Price Change: 0.0%; Yield: 0.0%
INVESTMENT THESIS: Nvidia is well positioned to benefit from ramping AI and data center spending. The company pioneered accelerated computing to help solve the most challenging computational problems. Nvidia is now a full-stack computing infrastructure company with data-center-scale offerings that are reshaping the industry. The company's full stack includes the foundational CUDA programming model that runs on all Nvidia GPUs, as well as hundreds of domain-specific software libraries, software development kits, or SDKs, and Application Programming Interfaces, or APIs. This deep and broad software stack accelerates the performance and eases the deployment of Nvidia accelerated computing for computationally intensive workloads such as artificial intelligence, or AI, model training and inference, data analytics, scientific computing, and 3D graphics, with vertical-specific optimizations to address industries ranging from healthcare and telecom to automotive and manufacturing. Nvidia reports in two business segments: Compute & Networking and Graphics. The Compute & Networking segment (78% of revenue, 85% of operating income) is comprised of Data Center accelerated computing platforms and end-to-end networking platforms, including Quantum for InfiniBand and Spectrum for Ethernet; NVIDIA DRIVE automated-driving platform and automotive development agreements; Jetson robotics and other embedded platforms; Nvidia AI Enterprise and other software; and DGX Cloud software and services. The Graphics segment (22% of revenue, 15% of operating income) includes GeForce GPUs for gaming and PCs, the GeForce NOW game streaming service and related infrastructure; Quadro/NVIDIA RTX GPUs for enterprise workstation graphics; virtual GPU, or vGPU, software for cloud-based visual and virtual computing; automotive platforms for infotainment systems; and Omniverse Enterprise software for building and operating metaverse and 3D internet applications.
Target Price: $175; Rating One
Panic Point: $112
RISKS: Market and interest rate risk, credit risk, country risk, and operational risk, including cybersecurity.
Qualcomm Inc. QCOM; $156.79; 1,135 shares; 3.51%; Sector: Technology
UPDATE: Shares of Qualcomm (QCOM) continued to underperform the market in November despite posted reporting October quarter results and guidance that bested consensus forecasts and included a significant boost to its repurchase program. As we discussed in our note to you, our view was the quarterly earnings call was more of a primer on what to expect at Qualcomm’s November 19 Investor Day. At that event, Qualcomm aimed to show how, over the next few years it will reduce its reliance on the smartphone market (75% of fiscal 2024 sales) to roughly half of its sales mix by 2029. Putting the dollars together, Qualcomm targets growing what it calls these diversification revenue streams by $13.7 billion to $22 billion over the next five years. The long-term target is for 50% of overall revenue to come from IoT and automotive with the other half from handsets. The math means the handset business is expected to be around $22 billion, compared to the $24.9 billion it accounted for over the last 12 months. That step down is the result of Qualcomm’s Apple business winding down over the next few years versus share gains in the Android ecosystem. The market’s reaction was clearly one of “wait and see” and the key to QCOM shares will be progress posted by Qualcomm toward these multi-year goals but also what we see in the marketplace as new auto, PC, and other device models are brought to market. While we had enough to see QCOM shares hitting our $255 price target should management deliver on its multi-year targets, as prudent investors that means even after knowing what we now know, we tempered the company’s outlook with some caution. In doing so, we reduced our long-term price target for to $200. As QCOM shares settled out after the Investor Day, we picked up some additional shares for the portfolio this week and knocked our panic point to $140. Two items on our near-term radar for the shares are Taiwan Semi’s December revenue report and the start of the litigation between Qualcomm and Arm Holdings.
1-Wk. Price Change: -2.3%; Yield: 2.2%
INVESTMENT THESIS: Qualcomm focuses on foundational technologies for the wireless industry, including 3G (third generation), 4G (fourth generation), and 5G (fifth generation) wireless technologies and processor technologies including high-performance, low-power computing, and on-device artificial intelligence technologies. As a connected processor company, its technology roadmap aims to enable the connected intelligent edge (the next generation of smart devices) across industries and applications beyond handsets, including automotive and the Internet of Things (IoT). Qualcomm has three reportable segments: QCT (Qualcomm CDMA Technologies) semiconductor business, which develops and supplies integrated circuits and system software based on 3G/4G/5G and other technologies for use in mobile devices; automotive systems for connectivity, digital cockpit, and ADAS/AD; and IoT including consumer electronic devices; industrial devices; and edge networking products. QCT accounts for 80%-85% of revenue. QTL (Qualcomm Technology Licensing) licensing business grants licenses or otherwise provides rights to use portions of the company's intellectual property portfolio, which includes certain patent rights essential to and/or useful in the manufacture and sale of certain wireless products. QTL accounts for ~15% of Qualcomm's revenue but contributes a greater portion of the company's operating income.
Target Price: $200; Rating: One
Panic Point: $140
RISKS: Customer risk, technology advancement, competition risk, third-party supplier, and manufacturing partner risk.
Universal Display OLED; $168.41; 1,115 shares; 3.70%; Sector: Technology
UPDATE: Following Universal Display’s (OLED) September quarter earnings in late October, which contained potentially overly conservative guidance for the current quarter, the shares underperformed the market by a wide margin over the ensuing weeks. We bided our time as OLED shares approached and then entered oversold territory in late October. Following several developments that confirmed the growing adoption of organic light-emitting diode display technology in markets outside of smartphone, we scooped up additional OLED shares this week. As we made that move, we reset the position’s panic point at $140. With more than 40% of the smartphone market not yet using organic light-emitting diode display technology we see further adoption in that market coming, but our focus for Universal and its shares remains on the wider adoption of organic light-emitting diode technology in multiple markets (TV, PC monitors, tablets, auto, and eventually general illumination). Next catalysts for the shares include Taiwan Semi’s November revenue report and the expected December release of Apple’s next iOS update that will include more Apple Intelligence capabilities.
1-Wk. Price Change: 2.7%; Yield: 1.0%
INVESTMENT THESIS: Universal Display focuses on the development and commercialization of organic light-emitting diode (OLED) technologies and materials for use in display and solid-state lighting applications. OLED displays are capturing a growing share of the display market, especially in the mobile phone, television, monitor, wearable, tablet, notebook, personal computer, augmented reality (AR), virtual reality (VR), and automotive markets. This adoption reflects advantages over competing display technologies concerning power efficiency, contrast ratio, viewing angle, video response time, form factor, and manufacturing cost. Universal's business strategy is to develop new OLED materials and sell existing and new materials to product manufacturers for display applications, such as mobile phones, televisions, monitors, wearables, tablets, portable media devices, notebook computers, personal computers, and automotive applications, and specialty and general lighting products. The company also looks to license its OLED material, device design, and manufacturing technologies to those manufacturers. As such, Universal has a significant portfolio of proprietary OLED technologies and materials with more than 5,500 patents issued and pending worldwide.
Target Price: Reiterate $250; Rating: One
Panic Point: $140
RISKS: Patent and Intellectual property protection; maintaining OLED manufacturing and customer relationships; technology risk; market risk.
Vulcan Materials Company VMC ; $284.61; 613 shares; 3.45%; Sector: Building Materials
UPDATE: Quarter to date, shares of Vulcan Materials (VMC) have been a strong contributor to the portfolio with their double-digit move higher. Demand for the company’s aggregates continues to benefit from non-residential construction and multiple new projects across data centers, airports, healthcare, and battery manufacturing. That demand bodes well for further price realization in 2025 and margin improvement at Vulcan. We continue to think 2026 is a potential peak year for construction activity as the Fed delivers additional rate cuts in the coming quarters, which should benefit residential and non-residential construction activity. Upcoming catalysts for the shares include the soon-to-be-published October Construction Spending report and formal policy announcements as President-elect Trump and his administration take the reins in January. Should VMC shares find their way to the 50-day support level near $260 that would be a nice pick-up point for members. Earlier this month UBS initiated coverage on VMC shares with a Buy rating and a $349 price target.
1-Wk. Price Change: 1.9%; Yield: 0.6%
INVESTMENT THESIS: Vulcan Materials operates primarily in the U.S. and is the nation's largest supplier of construction aggregates (primarily crushed stone, sand, and gravel), a major producer of asphalt mix and ready-mixed concrete, and a supplier of construction paving services. Its products are the indispensable materials used in building homes, offices, places of worship, schools, hospitals, and factories, as well as vital infrastructure including highways, bridges, roads, ports and harbors, water systems, campuses, dams, airports, and rail networks. Ramping spending associated with the Biden Infrastructure Law should drive demand for Vulcan's products over the coming years. Vulcan has historically complemented its organic growth prospects by acquiring businesses to expand its geographic reach and product scope. Since 2014, the company has acquired more than two dozen companies, including the 2021 acquisition of U.S. Concrete. That combination has allowed the company to deliver steady top and bottom-line growth over the last decade, with only a modest decline when the pandemic hit in 2020.
Target Price: Reiterate $300; Rating: One
Panic Point: $225
RISKS: General economic and business conditions; dependence on the construction industry; timing of federal, state, and local funding for infrastructure; changes in the level of spending for private residential and private nonresidential construction.
TWOS
Apple AAPL ; $229.87; 790 shares; 3.59%; Sector: Technology
UPDATE: Quarter to date, Apple (AAPL) shares are down modestly, making them a slight drag on the portfolio. Recent comments from Skyworks (SWKS), Qualcomm, and Taiwan Semi point to Apple’s iPhone guidance for the current quarter skewing conservative. Our position remains that attractive trade-in values are helping foster some upgrade activity, but the real push isn’t likely to come until Apple releases more robust Apple Intelligence features. That thinking was echoed by AT&T and Verizon on their September-quarter earnings calls. In our view, a more pronounced upgrade cycle is likely to begin when Apple ships iOS 18.2, which will include ChatGPT integration, and is expected to debut in early to mid-December. That release and subsequent others are behind our thinking the iPhone upgrade cycle will be a stronger factor in 2025. With more Apple Intelligence features targeted for not only iPhone but Apple’s other product categories including Mac, iPad, and Wearables, we see a similar cadence unfolding for them as well as other software updates are released. As that happens, we should see further lift in the Services business, driving overall profits and EPS higher. We will stick with our $250 price target for now but will revisit it as warranted following the release of iOS 18.2. In keeping with our Two rating, should we see AAPL pull back closer to $210, all things being equal, that would be an area of interest for us to contemplate adding more shares.
1-Wk. Price Change: 2.2%; Yield: 0.4%
INVESTMENT THESIS: While we acknowledge that near-to-midterm performance remains heavily influenced by iPhone sales, the dynamic is shifting as investors finally place greater emphasis on Services growth. We are bullish on the 5G upgrade cycle and believe longer-term upside will continue to come as Services revenue grows its share of overall sales. Services provide for a recurring revenue stream at higher margins, a factor that serves to reduce earnings volatility while allowing for a higher percentage of sales to fall to the bottom line; as a result, we believe that Services growth and the installed base, are much more important than how many devices the company can sell in each 90-day period. In addition to improved profitability, we also believe the transparent nature of this revenue stream will demand an expanded price-to-earnings multiple as segment sales grow. Furthermore, we believe that Apple's desire to push deeper into the healthcare arena will help make its devices invaluable as more life-changing features are added and the company works to democratize health records. Lastly, also see upside resulting from increased adoption of wearables (think the Apple Watch) and potential new product announcements such as an AR/VR headset or an update on Project Titan, the company's secretive autonomous driving program.
Target Price: Reiterate $250; Rating: Two
Panic Point: Reiterate $185
RISKS: Slowdown in consumer spending, competition, lack of new product innovation, elongated replacement cycles, failure to execute on Services growth initiative.
Applied Materials Inc. AMAT; $174.88; 900 shares; 3.11%; Sector: Semiconductor Manufacturing
UPDATE: Shares of Applied Materials have been a drag on the portfolio quarter to date and following the company’s better-than-expected top and bottom-line October-quarter results we reduced our price target to $210 from $220. Part of that move was our taking a more conservative view on CHIPs Act stimulus dollars being put to work in the coming quarter. As the time for the Biden administration draws to a close, we are seeing it move quickly to release earmarked CHIPs Act funding dollars as it aims to award more than $30 billion in funds in the coming weeks. At the same time, we are also starting to see funds flow from the European Chips Act, which aims to bolster the EU’s chip production market share to 20% from its current 10%. Understanding the impact of those programs and tightening chip industry capacity that should drive semi-cap equipment spending to hit $400 billion between 2025-2027, we opted to pick up more AMAT shares this week. Alongside that move, we reset our panic point for the shares at $155.
1-Wk. Price Change: 3.6%; Yield: 0.9%
INVESTMENT THESIS: Applied provides manufacturing equipment, services, and software to the semiconductor, display, and related industries. With its diverse technology capabilities, Applied delivers products and services that improve device performance, power, yield, and cost. Applied's customers include manufacturers of semiconductor chips, liquid crystal, and organic light-emitting diode displays, and other electronic devices. Applied operates in three reportable segments: Semiconductor Systems (73% of 2022 revenue, 78% of 2022 operating income), Applied Global Services (22%, 19%), and Display and Adjacent Markets (5%, 2%). Key customers include Samsung (12% of 2022 sales), Taiwan Semiconductor (20%), and Intel (10%).
Target Price: Reiterate $210; Rating: Two
Panic Point: $155
RISKS: Manufacturing and Supply Chain, Competitive Factors, Government Regulation, Technology Change.
Costco Wholesale COST; $964.01; 210 shares; 4.01%; Sector: Consumer Staples
UPDATE: Shares of Costco have been a solid performer for the portfolio as they’ve continued to build on their October gains during November. That started with the company’s enviable October revenue report, which showed another month of impressive U.S. comp sales. When we matched that figure against the October Retail Sales report and October-quarter comp sales from Walmart and Target, it was evident Costco continued to win consumer wallet share over the few months. With comments that consumers are leaning into promotional activity as well as digital shopping, we continue to see Costco well positioned for further share gains during the holiday shopping season. We also see further gains for the all-important membership fee revenue stream. Costco aims to add another 26 net new locations in the coming year after opening 30 over the last 12 months, 14 of which opened in the August quarter. These recent and projected openings should help drive additional gains in the company’s membership, which stood at 76.2 million paid households and 136.8 million cardholders exiting August. To that, we can add the 35.4 million paid executive memberships, up 9.6% versus last year. In thinking about those figures, let’s remember the membership price increase went into effect on September 1, so it makes sense that as newer memberships anniversary, Costco will see more benefits from that price hike. During November we boosted our COST price target to $975 from $950 and set a pick-up point at $875. We will review both levels as we move through the holiday shopping season and digest Costco’s November revenue report ahead of its next earnings report on December 12.
1-Wk. Price Change: 6.3%; Yield: 0.5%
INVESTMENT THESIS: We like Costco's long-term prospects, driven by a club-based operating model that focuses on volumes, not margins, and therefore offers its customers a value proposition of everyday low prices. The strength of this model has created an incredibly loyal customer base with low churn and continued share gains in both bricks-and-mortar and e-commerce. This is a global concept, evidenced by the strength of sales both in the U.S. and abroad, which includes an emerging China opportunity. We see the company's membership model as a key differentiator vs. other retailers and its plans to open additional warehouse locations in the coming quarters should drive retail volumes and the higher-margin membership fee income as well. We also appreciate management's approach to capital returns and their willingness to return cash when it is in excess on the balance sheet.
Target Price: Reiterate $975. Rating: Two
Panic Point: $750
RISKS: Inability to pass through higher costs, fuel prices, weaker consumer, and membership churn.
Dutch Bros BROS; $51.20; 3,070 shares; 3.14%; Sector: Consumer Cyclical
UPDATE: Quarter to date, the portfolio’s top performer has been Dutch Bros (BROS), which is up more than 60%. Following the short squeeze that followed the company’s better-than-expected September-quarter earnings report, we locked in a hefty slice of gains on the position even as we lifted our price target to $50 from $39. Helping spur the shares higher since we made that move are reports Dutch Bros is testing new food options, including sweet and savory hot food items. With food currently making up less than 2% of sales at the company, early indications are Dutch Bros will follow a similar move to the one Starbucks made more than a decade ago. For the 12 months ending September 2024, Food at Starbucks accounted for 23% of company-operated store revenue. We see similar success at Dutch Bros, and as more details are revealed we will revise our BROS price target as needed. Near-term, some may be concerned about consumers being selective, but our thinking is that concern is overshadowed by the company’s footprint expansion and more affordable prices. As the Fed moves deeper into its rate-cutting cycle hurdle rates and borrowing costs for new construction projects should improve. Given its cash-rich balance sheet, access to capital, and current footprint, Dutch Bros could continue to expand at a healthy clip in 2025, in our view. Currently, BROS shares are deep in overbought territory given the RSI reading above 80. In keeping with our Two rating, members should wait for a pullback to more reasonable levels before committing fresh capital. Examining the chart, we see a gap near the 50-and 100-day moving averages
1-Wk. Price Change: 9.8%; Yield: 0.0%
INVESTMENT THESIS: Dutch Bros is an operator and franchisor of drive-thru shops that focus on serving high-quality, hand-crafted beverages with unparalleled speed and superior service. As of June 30, 2024, there were 912 shops in operation in 18 U.S. states, of which 612 were company-operated and 300 were franchised. Coffee-based beverages make up ~50% of the menu mix, and ~25% of the menu mix is based upon the company’s proprietary Blue Rebel energy drink, which is highly customizable with flavors and modifiers and can be served blended or over ice. The energy platform helps unlock the afternoon daypart and broadens the company’s appeal. The remaining 25% of the menu mix is a wide variety of teas, lemonades, sodas, and smoothies. Through the first half of 2024, Dutch Bros opened 81 shops and targets 150-165 new ones for all of 2024. The company’s west-to-east expansion is a time-tested strategy that should drive revenue and EPS growth over the next several years.
Target Price: Reiterate $50; Rating: One
Panic Point: $35
RISKS: Commodity risks, labor costs, interest rate risk, inflation.
Eaton Corp. ETN; $377.41; 360 shares; 2.69%; Sector: Industrials
UPDATE: After a flat October, November has been a much stronger month for Eaton (ETN) shares leaving them up double-digits quarter to date. That made for rather good timing for our very late October acquisition of more shares for the portfolio. As we made that move, based on the company’s backlog and the expected ramp in mega construction projects in 2025, we boosted our ETN price target to $380 from $350. Following Cisco’s accelerating data center product order growth in its October earnings report, rising capital spending levels from the likes of Amazon, Alphabet, Meta, and Microsoft, and positive development pipeline comments from data center REIT companies Digital Realty Trust and Equinix in mid-November we boosted our ETN price target to $400 from $380. We continue to see Eaton’s business benefiting from the Fed’s eventual efforts to bring monetary policy back to a more neutral footing, which should stimulate overall construction demand in the coming quarters. During November, UBS boosted its ETN price target to $431 from $330, and BofA Global Research increased its target to $410 from $350.
1-Wk. Price Change: 5.1%; Yield: 1.0%
INVESTMENT THESIS: Eaton is an intelligent power management company that makes products for data center, utility, industrial, commercial, machine building, residential, aerospace, and mobility markets. That business is positioned to capitalize on the megatrends of electrification, energy transition, and digitalization. We see Eaton helping address the power pain point created by data center, EV charging infrastructure, and other drivers of electricity demand. Research estimates that data center power demand will grow 160% by 2030, accounting for 3%-4% of global power up from 1%-2% today. Data centers will use 8% of U.S. power by 2030, compared with 3% in 2022.
Target Price: Reiterate $400; Rating: Two
Panic Point: $285
RISKS: Raw material costs, labor costs, end market volatility, government legislation.
Elastic N.V. ESTC; $108.03; 1,755 shares; 3.75%; Sector: Consumer Cyclical
UPDATE: Our decision to build up the portfolio’s exposure to Elastic (ESTC) shares in October proved to be a smart one following the strong showing they had leading into the company’s October-quarter earnings report this week. That report confirmed Elastic is benefiting from enterprise AI adoption as measured by its expanding customer count, continued gains in subscription revenue per customer, and number of customers using its AI-powered solutions. Better-than-expected revenue growth, tight expense control, and margin leverage led to EPS that crushed the consensus forecast, while increasing deferred revenue paved the way for Elastic to hike its outlook well above the consensus forecast. In our note to members, we discussed how that led us to lift our price target to $135 from $105 but also why the prudent move was to downgrade ESTC shares to a Two rating. We suspect management’s operating margin outlook is conservative but reflects ongoing investments in AI to drive future growth. With the shares overbought, we’ll evaluate opportunities for newer members to jump on board as the relative strength index (RSI) pulls back to more normalized levels and the technical setup improves. In response to Elastic’s earnings and guidance, Oppenheimer boosted its price target to $140, while Barclays lifted its to $138 from $105.
1-Wk. Price Change: 25.2%; Yield: 0.0%
INVESTMENT THESIS: As digital transformation drives mission-critical business functions to the cloud, Elastic N.V. brings the portfolio exposure to search AI adoption across IT and enterprise business lines as companies look to drive productivity. Elastic bills itself as the Search AI company and its Elastic Search AI Platform as a hosted, managed service across major cloud providers, including Amazon Web Services (AWS), Google Cloud, and Microsoft’s Azure in more than 55 public cloud regions globally. Customers can also deploy Elastic’s platform across hybrid clouds, public or private clouds, and multi-cloud environments. What we like even more about this is Elastic’s subscription-based business model, which accounts for just over 93% of its total revenue stream. As we’ve discussed before with other companies, this affords not only good visibility but also predictable cash flow and earnings. Moreover, the gross margins associated with the subscription business are above 80%, which helps explain the rising margin profile and EPS as that business has come to account for a greater percentage of overall revenue. When it comes to potential risks, one sign that would lead us to reconsider owning the shares would be if either Elastic’s customer count or its subscription revenue per customer stalled. Another item we’ll be watching because of Elastic’s geographic mix, with 40% of its revenue outside of the U.S., is the dollar and its corresponding foreign exchange impact.
Target Price: Reiterate $135; Rating: Two
Panic Point: $68
RISKS: Enterprise software spending, AI adoption, competitive dynamics, foreign exchange risk.
First Trust Nasdaq Cybersecurity ETF CIBR; $63.61; 2,530 shares; 3.19%; Sector: Cybersecurity
UPDATE: Each time we note ripped-from-the-headlines confirmation points for the portfolio and its underlying strategy, one constant is the signals for cybersecurity demand. As we head into the holiday shopping season, VikingCloud’s 2024 Holiday Cyber Threat Survey points out 80% of retailers have already experienced a cyberattack in the past year, with nearly all hit multiple times and because of the surge of in-store and online shoppers and the targeting of point-of-sale (POS) devices, they are at increased risk in the coming weeks. That and the consistent flow of cyberattack headlines made CIBR shares a nice contributor to the portfolio’s overall performance quarter to date. We still believe heavy spending in this space is necessary for businesses to protect their crown jewels. The use of AI by bad actors in their attacks means we are not likely to see any slowdown in cybersecurity spending on the horizon. As we approach the end of the current earnings season, we’ll be listening for management comments about cybersecurity spending, and revisiting our CIBR price target as needed. When cybersecurity companies report their earnings, we’ll be looking for rising deferred revenue metrics in their financials, a harbinger of higher revenue ahead. Case in point, when Palo Alto Networks reports its latest deferred revenue figure rose to $5.5 billion, up double-digits year over year. For newer members who have missed out on CIBR shares, we see strong support near $60.
1-Wk. Price Change: 3.5%; Yield: 0.0%
INVESTMENT THESIS: The First Trust Nasdaq Cybersecurity ETF seeks investment results that correspond generally to the price and yield (before the fund's fees and expenses) of an equity index called the Nasdaq CTA Cybersecurity Index. The Nasdaq CTA Cybersecurity Index is designed to track the performance of companies engaged in the cybersecurity segment of the technology and industrial sectors. It includes companies primarily involved in the building, implementation, and management of security protocols applied to private and public networks, computers, and mobile devices to protect the integrity of data and network operations. To be included in the index, a security must be listed on an index-eligible global stock exchange and classified as a cybersecurity company as determined by the Consumer Technology Association. Each security must have a worldwide market capitalization of $250 million, have a minimum three-month average daily dollar trading volume of $1 million, and have a minimum free float of 20%.
Target Price: Reiterate $68; Rating: Two
Panic Point: Reiterate $50
RISKS: Cybersecurity spending, technology, and product development, the timing of product sales cycle, new products, and services in response to rapid technological changes and market developments as well as evolving security threats.
Labcorp Holdings Inc. LH; $239.67; 610 shares; 2.90%; Sector: Healthcare
UPDATE: Labcorp (LH) shares have pushed through to create a nice series of higher highs, and higher lows, delivering a high-single-digit gain quarter to date. That is our textbook definition of an uptrend, and with strong volume to boot, we feel confident higher prices are in store for this company. The recent low in October was tested successfully just before the stock started to turn upward. MACD is strong even as the stock has pulled back recently, and the 20-day moving average held nicely this week, setting up a potential move past the recent highs. During the month, the company finalized its acquisition of select assets and molecular testing location of Lab Works. We continue to favor LH shares as the company continues to benefit from the growing number of hospital and regional lab deals it is inking and digests its acquisition of Invitae. While Invitae was a drag on diagnostic margins in the quarter, Labcorp continues to see it being accretive next year, which bodes well for incremental profit dollars falling to the bottom line. Management has the capacity, and the company has the balance sheet for other nip-and-tuck acquisitions in this still-fragmented medical testing and diagnostics business. As we move into 2025, we will monitor the regulatory environment and the Trump administration’s healthcare and government efficiency moves. Should we see LH drift back to the $225 level, barring fresh developments, that would be an area at which we would consider adding additional shares.
1-Wk. Price Change: 1.9%; Yield: 1.2%
INVESTMENT THESIS: Labcorp is a global leader in innovative and comprehensive laboratory services that provides vital information to help doctors, hospitals, pharmaceutical companies, researchers, and patients make clear and confident decisions. By leveraging its diagnostics and drug development capabilities, the company provides insights and accelerates innovations to improve health and improve lives. The company is organized under two segments, consisting of Diagnostics Laboratories (Dx), which includes routine testing and specialty/esoteric testing, and Biopharma Laboratory Services (BLS), consisting of Early Development Research Laboratories and Central Laboratory Services. Our attraction to LH shares stems from the combination of the aging population driving diagnostic testing growth and the increasing array of diagnostic testing as well. That combination is expected to drive the healthcare testing services market to $12.6 billion by 2029, from $7.4 billion in 2024, according to Markets and Markets. To augment its position in oncology, women's health, autoimmune diseases, and neurology, the company has been expanding through acquisitions and partnerships with health systems and regional local labs.
Target Price: Reiterate $260; Rating: Two
Panic Point: Reiterate $190
RISKS: Macroeconomic factors, changes in healthcare reimbursement models and products, government regulations, product discontinuations or recalls.
Mastercard MA; $520.86; 275 shares; 2.83%; Sector: Info. Tech
UPDATE: Mastercard (MA) was a steady performer for the portfolio in Q3 2024 and that continues to be the case in the current quarter. Following the company’s mid-November Investment Community Meeting, we boosted our price target to $540 from $535 and nudged our panic point to $450 from $420. That was a far more conservative adjustment compared to other price target changes across Wall Street. As we explained in a note to members, we find it hard to justify paying up even more from a valuation perspective implied by those other price targets for modestly slower EPS growth prospects ahead. Favorable real wage gains found in October jobs data support continued consumer spending as we head into the holiday shopping season. So do falling gas prices, further progress on inflation, and lower interest rates. Expectations for the 2024 holiday shopping season are favorable and based on comments from United Airlines and American Express so is December quarter travel. As we move through November and early December, signs of more favorable holiday spending could lead us to revisit that target. At the same time, if market forces pull MA near key support levels, we’ll consider adding additional shares provided there is ample upside to our price target.
1-Wk. Price Change: -0.2%; Yield: 0.5%
INVESTMENT THESIS: Mastercard is a card network company that benefits from the secular shift away from cash transactions and toward card-based and electronic payments. On Covid-19 dynamics, we view MA as a "reopening" play and an economic recovery play within technology because its cross-border volumes fell sharply during the pandemic but will rebound as mobility increases and travel restrictions ease. Mastercard has more international exposure relative to Visa (V), making its growth outlook more susceptible to new travel restrictions. However, we view MA as the better long-term play as we are betting on that inevitable recovery.
Target Price: $540; Rating: Two
Panic Point: $450
RISKS: The recovery in cross-border transactions, regulation in the payments market, competition from other fintechs, and pricing pressures.
Meta Platforms META; $559.14; 185 shares; 2.05%; Sector: Communication Services
UPDATE: Meta shares are down modestly quarter to date, lagging the overall market’s move higher over the last several weeks. We’ve seen this before when management communicated expectations for significant capex growth in coming quarters. However, what we saw in the company’s September-quarter results showed Meta continues to deliver meaningful margin expansion despite ramping capex levels. Meta’s operating margin in Q3 2024 widened to 42.75%, the highest level in multiple quarters and the company’s guidance suggests a modest decline in the current quarter to around 42% or so based on its $45 billion to $48 billion December revenue forecast. Looking at these figures that point to greater profitability this year compared to 2023 means the market should eventually deduce that Meta is not struggling to invest for the future at the expense of near-term profitability. Even if its H2 2024 operating margin of 42.4% is the run rate for 2025, it’s still a nice step higher, which means Meta can continue to invest while delivering favorable bottom-line growth even as it faces more difficult year-over-year revenue comparisons in H2 2025. Helping to address those comparisons, Meta is expected to roll out ads to its Threads social media platform early next year. We picked up some additional META shares in late October and again earlier this month. Even after those moves, META shares account for a relatively small part of the portfolio’s assets. All things being equal, we would be inclined to pick up more, and potentially revisit our Two rating at the right price level. Currently, the shares are trapped between technical resistance near $573 and support with the 100-day moving average near $539, but a move closer toward that support level would make an increasingly favorable risk-to-reward trade-off even more so.
1-Wk. Price Change: 0.9%; Yield: 0.4%
INVESTMENT THESIS: Meta segments its business between Family of App Products, which includes Facebook, Instagram, Messenger, Threads, and WhatsApp, and Reality Labs Products, which includes its metaverse and investments and future product R&D. Family of Apps accounts for ~99% of company revenue and 100% of company operating profit. Substantially all of Meta’s revenue is currently generated from advertising on Facebook and Instagram. Family daily active people (DAP) was 3.27 billion on average for June 2024, an increase of 7% year-over-year. Meta forecasts capital expenditures of approximately $37 billion to $40 billion in 2024 and expects its capital expenditures to grow significantly in 2025 to support our AI research and product development efforts. Meta is positioned to benefit from the ongoing shift toward digital advertising and the adoption of AI across its product offerings. We recognize Meta is ramping up capital spending as part of the current AI arms race, but we see that as an investment that should drive productivity in its core advertising business. As the company harvests that investment, we could see a step up in margins much like we saw in 2023.
Target Price: Reiterate $675; Rating: Two
Panic Point: $475
RISKS: Ability to add and retain users and user engagement; marketing spend; new products or changes to existing ones; competitive risk, geopolitical risk.
Microsoft Corp. MSFT; $417.00; 425 shares; 3.50%; Sector: Technology
UPDATE: Like a few other big tech holdings, shares of Microsoft (MSFT) have been a modest drag on the portfolio so far this quarter. The company is in a transition period this quarter and next based on management’s September-quarter guidance that called for slightly slower revenue growth this quarter and next at Azure as it brings needed capacity online to meet demand. To be clear, “slightly slower” means around 31%-32% instead of the 34% growth posted by Azure in the September quarter. As we discussed in Friday’s video, we continue to see signs of greater AI adoption in the coming quarters, which should benefit Microsoft’s cloud business as well as its subscription revenue streams in the coming quarters. Helping bolster its competitive position, at Microsoft Ignite this week the company introduced several new AI-powered tools and chips as it continues to integrate AI across applications and infrastructure software. Microsoft also introduced Azure AI Foundry, which helps businesses build their own artificial intelligence agents, as well as develop other AI applications. Given its reach across its various business lines, we continue to see Microsoft well-positioned to benefit from AI and cloud adoption. Next week brings quarterly results from HP and Dell, and we’ll be interested in their comments about AI PC adoption as well as Dell’s on AI server demand. Should we see MSFT move closer to the $400 level, we would be interested in scooping up more shares, and possibly revisiting our current Two rating ahead of Azure’s revenue re-acceleration.
1-Wk. Price Change: 0.5%; Yield: 0.8%
INVESTMENT THESIS: We believe the cloud to be a secular growth trend and that upside to the shares will result from Microsoft's hybrid cloud leadership as the company grabs market share in this expanding industry. While companies may look to build out multi-cloud environments, Microsoft's Azure offering will be a prime choice thanks to its decision to provide the same "stack" used in the public cloud, to companies for their on-premises data centers. Additionally, we would note that hybrid environments are currently the preference for most companies because they allow them to maintain critical data in-house while taking advantage of the agility and scalability provided by public clouds. Outside of the cloud opportunity, we maintain a positive view on the company's growing gaming business, which we believe is becoming an increasingly prominent factor in the Microsoft growth story as gaming becomes more mainstream, management works to convert its gaming revenue from one-time license purchase to a recurring subscription model and as technologies like augmented/virtual reality evolve. Finally, as it relates to LinkedIn and other subscription-based services such as O365 and various Dynamics products, we continue to value them highly for their recurring revenue streams, which, we remind members, provide for greater transparency of future earnings.
Target Price: $480; Rating: Two
Panic Point: Reiterate $350
RISKS: Slowdown in IT spending, competition, cannibalization of on-premises business by the cloud.
Morgan Stanley MS; $134.69; 1,535 shares; 4.09%; Sector: Financial Services
UPDATE: What a month it has been for Morgan Stanley (MS). The stock ripped higher just after the election leaving a massive gap that may not be filled for some time. For now, MS shares are moderately overbought but have continued to push higher of late making them one of the best-performing financial stocks. One of the clear catalysts of that performance was the outcome of the 2024 presidential election and the prospects for a more favorable regulatory environment. That bodes well for Morgan Stanley given its investment banking positions in M&A and capital formation. Echoing that thought, this week Goldman Sachs CEO David Solomon called for a pick up in both equity capital raising and M&A activity under the Trump administration. During the month, in a prudent move, we sold some shares, locking in a slice of the stock’s big move. With the shares above our current price target, based on M&A expectations turning into announced deal flow and IPO filings becoming priced offerings, we’ll revisit that target.
1-Wk. Price Change: 0.5%; Yield: 2.7%
INVESTMENT THESIS: Morgan Stanley reports in three business segments: Institutional Securities (42% of trailing 12-month revenue, 38% of trailing 12-month Income Before Tax), Wealth Management (48%, 55%) and Investment Management (10%, 6%). While the IPO window has yet to reopen, the potential IPO class for 2024 continues to build with recent additions including Panera Bread, Reddit, Fanatics, and Skims, which is backed by Kim Kardashian. This along with the Fed increasingly likely to start cutting rates in H2 2024, suggests we are far closer to the IPO window opening on a sustained basis than we have been in some time. That would be a boon to private equity firms and others that have been nursing IPO candidates during the dark period and a positive for Morgan's investment banking business. Marginally lower rates could also generate a pick-up in M&A activity as the cost of capital with rates improving. As the Fed continues its cutting cycle to get rates back to normalized levels, that effort would also reduce rates for stock market alternatives, ones that quashed the "there is no alternative" trade earlier this year. That along with folks continuing to be behind in retirement savings bodes well for Morgan's wealth management business in the coming quarters.
Target Price: $130; Rating Two
Panic Point: $104
RISKS: Market and interest rate risk, credit risk, country risk, and operational risk, including cybersecurity.
PepsiCo Inc. PEP; $162.00; 940 shares; 3.01%; Sector: Consumer Defensive
UPDATE: Shares of PepsiCo (PEP), a Dividend King company, gave back all of their third-quarter 2024 gains and then some over the last eight weeks amid concerns over consumer spending and the rebound in the dollar. Because PepsiCo derives around 40% of its sales from markets outside the U.S., we see that dollar strength translating into currency headwinds for the company. However, October Retail Sales data showed Food & Beverage store sales accelerated over the last three months compared to the May-July 2024 period and the August to October 2023 one. As we move into the final six weeks of 2024, which contain several holidays, we suspect the seasonal pattern for PepsiCo’s businesses should once again unfold. In the September-quarter earnings report, we learned operating profits at Quaker are still recovering from product-related issues late in 2023. Further improvement is expected in the current quarter with that business being less of a drag on profit generation and the company’s bottom line. It’s also not lost on us that businesses will have very easy comparisons in H1 2025, helping drive what should be favorable year-over-year EPS comparisons. That mixed with the recent overbought status of PEP shares led us to pick up some additional ones for the portfolio this week.
1-Wk. Price Change: 2.1%; Yield: 3.3%
INVESTMENT THESIS: PepsiCo is one of the largest food-and-beverage companies globally. It makes, markets, and sells a slew of brands across the beverage and snack categories, including Pepsi, Mountain Dew, Gatorade, Doritos, Lays, and Ruffles. The firm uses a largely integrated go-to-market model, though it does leverage third-party bottlers, contract manufacturers, and distributors in certain markets. In addition to company-owned trademarks, Pepsi manufactures and distributes other brands through partnerships and joint ventures with companies such as Starbucks. The combination of the consumable nature of those products along with PepsiCo's ability to realize price increases has led to consistent revenue, EPS, and dividend growth during both the Great Recession and the Covid pandemic.
Target Price: Reiterate $185; Rating: Two
Panic Point: $148
RISKS: Economic conditions, supply chain constraints, raw material costs.
ServiceNow NOW; $1,060.60; 66 shares; 1.38%; Sector: Technology
UPDATE: Following the double-digit gain in Q3 2024 for the portfolio’s position in ServiceNow (NOW), the shares have powered ahead by more than 15% quarter to date. Midway through November we boosted our NOW price target to $1,100 from $1,000 following more signs confirming AI adoption in the enterprise. Included among those confirmation points is one from PYMNTS Intelligence that found 78% of surveyed CFO plan to increase their GenAI budgets next year. We continue to see ServiceNow well positioned for continued AI adoption as it focuses on removing friction from enterprise workflow and we like the recurring revenue nature of its predominantly subscription revenue business model (97% of total revenue). ServiceNow continues to target capturing 36% of the $3 trillion expected to be spent on AI by enterprises through 2027 that it addresses. We’ve commented before that if we could go back in time and load up even more on NOW shares than we did in June we would have. While we can’t go back in time, we will keep our eyes open for opportunities to add to the position.
1-Wk. Price Change: 4.9%; Yield: 0.0%
INVESTMENT THESIS: The addition of ServiceNow adds exposure to the enterprise as it deploys AI-enabled solutions across its enterprise workflow platform. The company’s “Now Platform” is a cloud-based solution with embedded AI and machine learning (ML) capabilities that help unify and digitize workflows, driving productivity. At the heart of it, the company’s platform automates workflows across an entire enterprise by connecting disparate departments, systems, and silos in a seamless way to unlock productivity. ServiceNow counts more than 8,100 global customers, including 85% of the Fortune 500, with 97% of its revenue from subscriptions that have notched a 98% renewal rate.
Target Price: Reiterate $1,100; Rating: Two
Panic Point: $750
The Trade Desk TTD; $129.70; 1,485 shares; 3.80%; Sector: Technology
UPDATE: So far in November, Trade Desk (TTD) shares have held their own, maintaining the strong gain they registered against the major market averages in October. That combination makes TTD shares a double-digit performer quarter-to-date. Following the company’s September-quarter earnings, we lifted our price target to $140 from $135. While the current quarter will see some benefit from 2024 political spending, that will fade as we move into 2025. That could lead to somewhat slower revenue growth compared to the 26% Trade Desk is tracking to deliver this year. But the prospects, especially those for CTV, should continue to drive favorable top-line and profit growth in the coming quarters as Netflix, Amazon, and others see their streaming video advertising revenue mix grow. Because we see further gains in Trade Desk’s business as streaming across multiple media formats continues to take advertising dollar share, we will remain owners of TTD shares. This week, Trade Desk shared plans to launch a connected TV operating system by the second half of 2025 dubbed Ventura. While we agree the streaming experience is less than optimal, we will want to know more about the particulars of this move and how it may impact the company’s relationship with other streaming platforms.
1-Wk. Price Change: 9.8%; Yield: 0.0%
INVESTMENT THESIS: The Trade Desk offers a cloud-based ad-buying platform that empowers its clients to plan and manage data-driven digital advertising campaigns across ad formats and channels, including video, display, audio, digital-out-of-home, and social. Modalities for those campaigns span a multitude of devices, such as computers, mobile devices, televisions, and streaming devices. This positions the Trade Desk to benefit from an accelerating shift toward digital advertising. That shift is expected to see digital advertising account for more than 70% of total ad spending in 2025 rising to ~74% by 2027. We also see the company benefiting from the use of digital advertising in the 2024 presidential campaign, which is expected to grow more than 150% compared to 2024, putting it around $3.5 billion.
Target Price: Reiterate $140; Rating: Two
Panic Point: $98
RISKS: Advertising spending; customer risk and loss; evolving market dynamics and competitive landscape; platform disruptions and outages.
United Rentals URI; $849.32; 148 shares; 2.48%; Sector: Industrials
UPDATE: After being little changed in October, shares of United Rentals (URI) powered ahead over the last few weeks making them once again a positive force for the portfolio. The stock is just above the 50-day moving average, an important marker where the stock has moved higher. Since July of this year, the 50-day moving average has been a springboard on four different occasions, so we like where the stock is currently and where it might be headed. Demand for the company’s rental equipment continues to benefit from non-residential construction and multiple new projects across data centers, airports, healthcare, and battery manufacturing. Our take is we’re a few years into multi-year infrastructure stimulus but when we factor in the looming rebound in the housing market, we’re probably about a third of the way through. We continue to think 2026 is a potential peak year for construction activity as the Fed delivers additional rate cuts in the coming quarters. Upcoming catalysts for the shares include the soon-to-be-published October Construction Spending report and formal policy announcements as President-elect Trump and his administration take the reins in January.
1-Wk. Price Change: 1.6%; Yield: 0.8%
INVESTMENT THESIS: United Rentals, the largest equipment rental company in the world, operates throughout the United States and Canada, and has a limited presence in Europe, Australia, and New Zealand. It serves industrial and other non-construction; commercial (or private non-residential) construction; and residential construction. Industrial and other non-construction rentals represented approximately 50% of rental revenue, primarily reflecting rentals to manufacturers, energy companies, chemical companies, paper mills, railroads, shipbuilders, utilities, retailers, and infrastructure entities; commercial construction rentals represented approximately 46% of rental revenue, primarily reflecting rentals related to the construction and remodeling of facilities for office space, lodging, healthcare, entertainment, and other commercial purposes; and residential rentals around 4% of revenue. We see the company benefiting on three fronts — the seasonal uptick in construction spending; the release of funds and projects associated with the five-year Biden Infrastructure bill; and the company's nip-and-tuck acquisition strategy that should further enhance its geographic footprint.
Target Price: Reiterate $875; Rating: Two
Panic Point: $675
RISKS: Industry and economic risk, competition and competitive pressures, and acquisition risk.
Waste Management WM; $224.41; 650 shares; 2.89%; Sector: Industrials
UPDATE: Shares of Waste Management (WM) have been a solid contributor to the portfolio’s gains so far this quarter given their outperformance compared to the S&P 500. Following the company’s late October earnings report, we boosted our WM price target to $235 from $220 given further margin improvement prospects in the coming quarters at the core Collection and Disposal business. When Waste closed its pending acquisition of Stericycle in early November we made a preliminary adjustment to our price target, lifting it to $245 alongside picking up more WM shares for the portfolio. We like that move in part because it expands Waste’s reach into the medical waste market, but it also brings opportunities for Waste to wring cost out of the business. We see that as a nice complement to our position in Labcorp, and one that should grow nicely alongside the medical test market. We also suspect it will follow the same path as Waste’s solid waste business, meaning nip-and-tuck acquisition opportunities. Once Waste Management discusses expected synergies and longer-term cost savings opportunities, we’ll factor that into our price target. We continue to favor the sticky residential business, especially as the company optimizes pricing while driving productivity as it continues to automate its fleeting. Outside the residential business, we see Waste benefiting from improving construction activity as the Fed moves monetary policy to a more neutral level in the coming quarters. Earlier this month, Waste declared its next quarterly dividend of $0.75 per share will be paid on December 20 to shareholders of record on December 6.
1-Wk. Price Change: 3.0%; Yield: 1.3%
INVESTMENT THESIS: 2024 will see more nonresidential construction activity because of the Biden Infrastructure Law, but now we can finally factor in activity for the CHIPs Act, which saw its first award this week. Other potential drivers include spending associated with the Inflation Reduction Act, including the much-awaited start of building out a nationwide network of EV charging stations. Recently President Biden announced an $8.2 billion passenger rail project, which will likely take several quarters to come onstream, leading us to think it's more of a 2025 catalyst. Alongside that bright outlook for WM's commercial business, automation efforts and pricing power in its sticky residential business should drive margins and EPS generation higher in the coming quarters.
Target Price: $245; Rating: Two
Panic Point: $185
RISKS: Industry and economic risk, competition and competitive pressures, and acquisition risk.
