Chart of the Day: This Holding Is Finding Support Where It Should
The stock is struggling to hold recent gains as competitors report average earnings.
You've reached your free article limit
You've read 0 of 1 free Pro articles.
Taking a look at the chart of TheStreet Pro Portfolio stock Builders FirstSource BLDR we can see the struggles taking place for the bulls. The stock has been in a downtrend since topping out in late September. And the series of lower highs, lower lows indicates the downtrend has been in place for quite some time. Candles on the top pane are purple and pink, which indicates bearish on the GoNoGo composite of indicators.
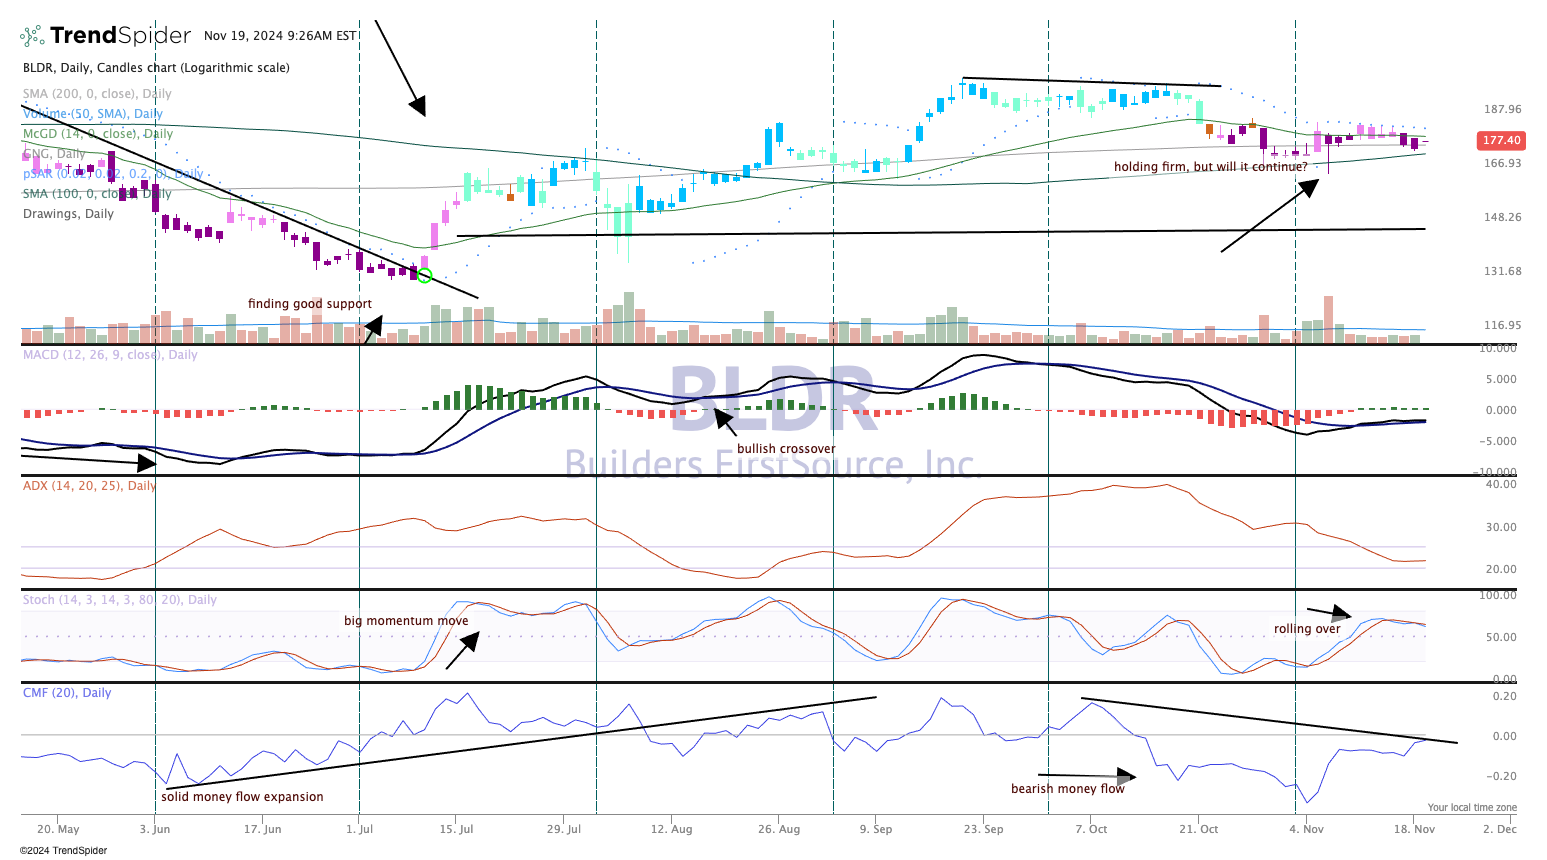
Most of the secondary indicators shown are also bearish. The parabolic SAR (stop and reverse) in the top pane has been bearish since early October. This indicator tells us a change in trajectory of the PRICE before it actually happens.
MACD (moving average convergence/divergence) has been bearish for nearly two months, and momentum is starting to die down as well, according to the stochastics (pane 4).
The only possible light here in a sea of darkness is the support at the 200-day moving average, which has held recently. The problem here is too many bounces on this moving average will weaken that support demonstrably, and with that rally from July there is not much support should the stock continue correcting toward the $150 area.
At the time of publication, TheStreet Pro Portfolio was long BLDR.
