This 'Powerfully Bullish Chart' Sends a Clear Message
The candles turned from teal to blue and just like that, a buy signal is in place.
You've reached your free article limit
You've read 0 of 1 free Pro articles.
The reliability of Costco COST is uncanny. With each dip in the stock price a buyer is afforded another opportunity to add shares, and for most shareholders those chances have been money in the bank.
A recent dip in Costco shares in late October to the $880 level has been ferociously bought by big institutions with both hands. Since then, the stock has made a nice series of higher highs, higher lows and continues to move into new high territory.
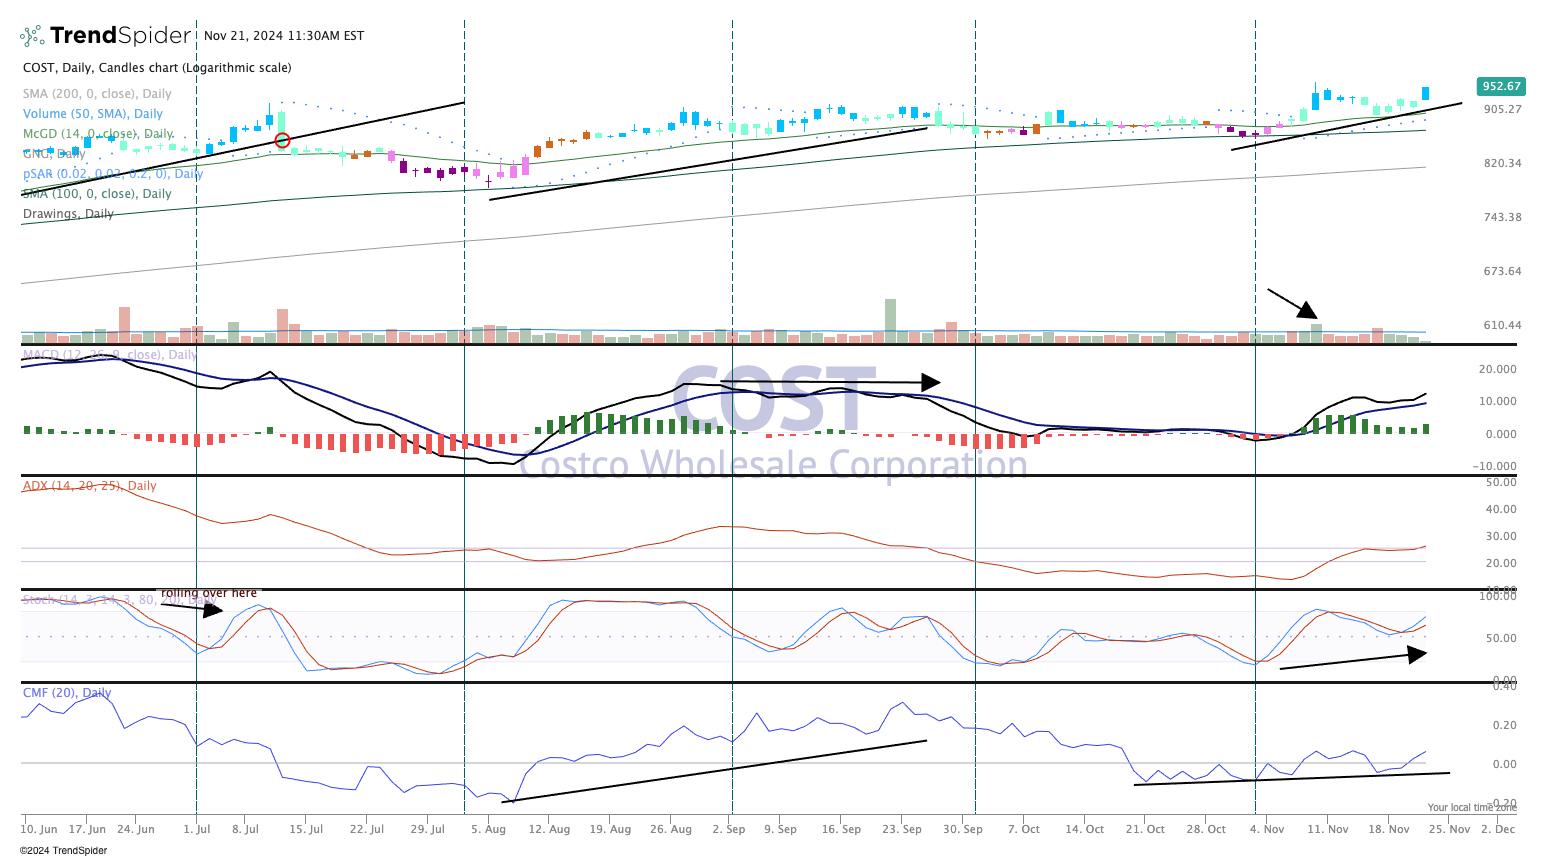
That is a powerfully bullish chart, but even looking at the secondary indicators yields the same conclusion: Stay long Costco!
The MACD (moving average convergence/divergence) remains on a buy signal. After a late October pullback the stochastics (pane 4) is moving higher once again, and money flow (bottom pane) is on the move.
We like Costco and rate it a Two in TheStreet Pro Portfolio.
At the time of publication, TheStreet Pro Portfolio was long COST.
