Charting the S&P 500: Still Bullish, but With a Downgrade
Markets can keep on correcting this month if buyers don’t re-appear.
You've reached your free article limit
You've read 0 of 1 free Pro articles.
With another down week in the market it appears a modest correction is underway. Of course, Friday’s rally action was positive, but the quality and finish was not the best.
A high-quality rally day finishes near the highs of the day and routs the bears and short-sellers viciously. While the markets did gap higher they only went sideways for most of the day, trading within a very tight 20-handle range.
The chart shows a modest downgrade in the price action from strong bullish to cautiously bullish (blue to teal). That’s not yet a problem unless there is more downside action and a move to pink is seen, but that might take some weeks to accomplish.
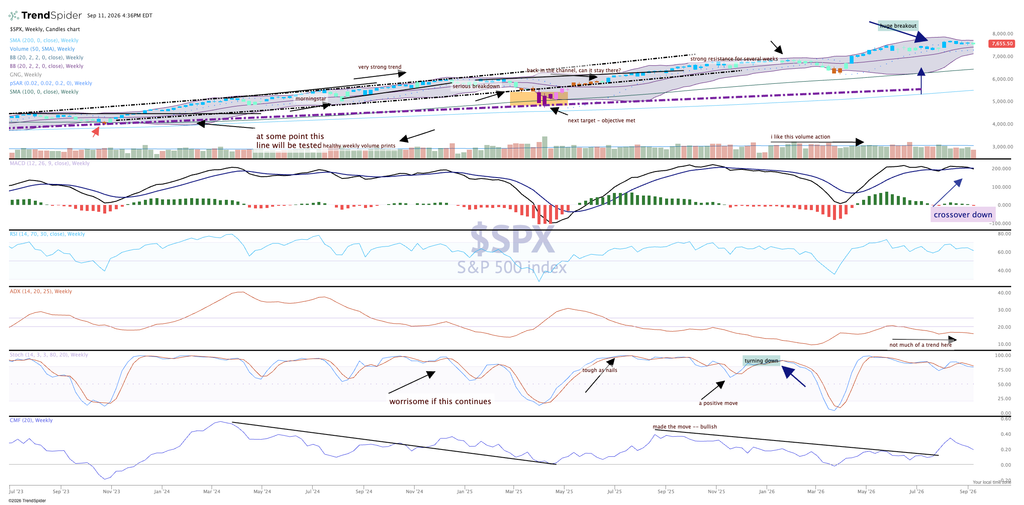
MACD is the first indicator to flash a bearish sign, with a crossover but needs to confirm it this week. Money flow has been poor for weeks and stochastics are starting to roll over.
All signs point to a corrective phase but the catalysts are not paying attention. If it doesn’t happen, then the markets could easily turn up again and make huge runs to all-time highs.
