Charting the S&P 500: We'll Ride the Momentum for Now
We know that the market is in need of a pullback, but we are not going to attempt to say when it will occur.
You've reached your free article limit
You've read 0 of 1 free Pro articles.
The S&P 500 weekly chart continues to cling to the channel created from late October. Since that time, the index is up a healthy 950 points, or 22%. That translates into an average monthly gain of about 4% during that period, which is a stunning number when we consider that monetary conditions are still tight (according to the Federal Reserve), interest rates are high and may remain higher for longer and commodities are on the rise -- something that may signal inflation is starting to turn back up. We’ll have more information on the inflation front later in the week with the release of March Consumer Price Index and Producer Price Index data.
S&P 500 Index
View Chart » View in New Window »
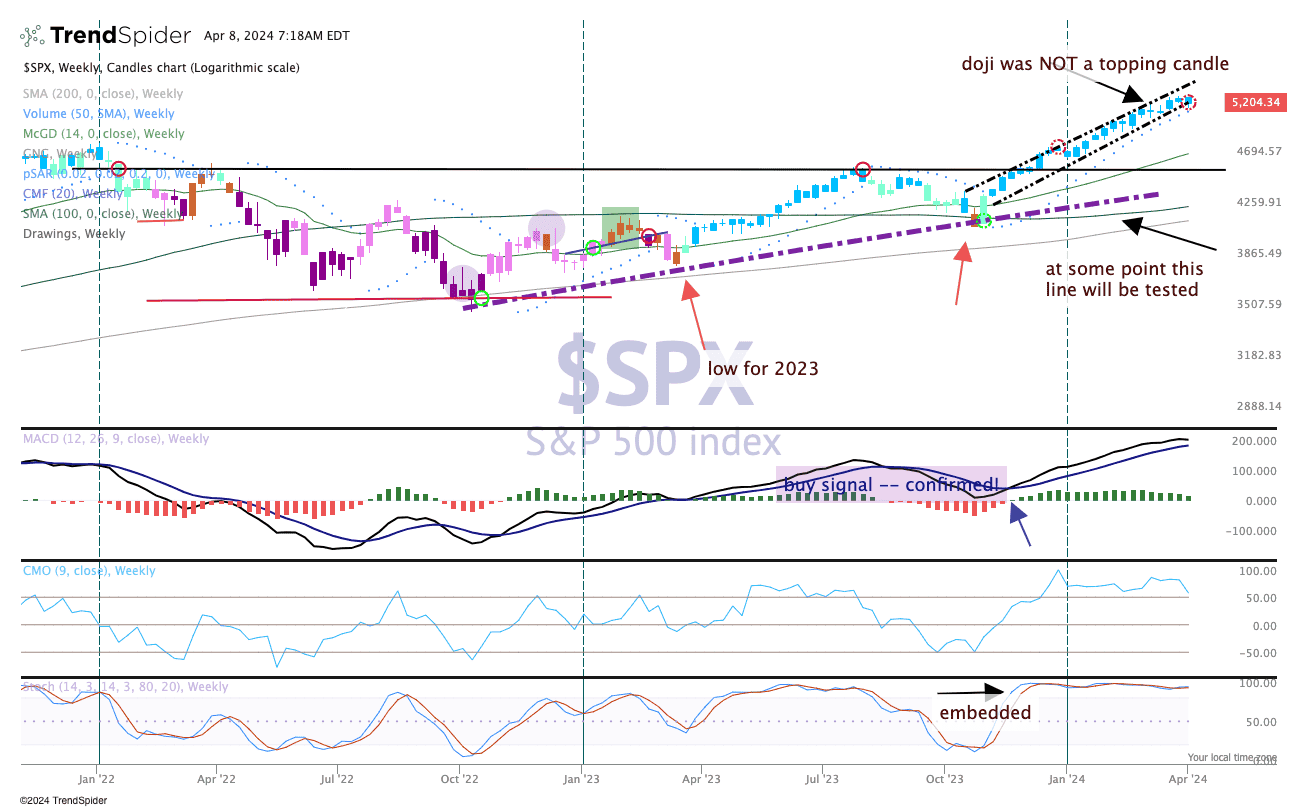
As for the chart, the indicators appear to be extended, so any sharp weekly pullback should not be a surprising. If anything, the pullback last Thursday contributed to some indicators rolling over, but stochastics at the bottom remain embedded and steady. What that means is any dips are likely to be bought by the professional trader.
We will continue to reference downside areas of interest for a bit longer as the market is in need of a pullback, but we are not going to say when that will occur. We’ll just ride the momentum for now and participate as long as the market momentum remains intact.
