Charting the Markets: S&P 500 Within Reach of a New Milestone
The 6100 marker is just the next hitching post on this incredible bullish journey.
You've reached your free article limit
You've read 0 of 1 free Pro articles.
Momentum is very bullish on the stock market right now. It is simply going to rise until it no longer has any gas left in the tank. That really does not explain what is happening, though, but with strong seasonal trends and heavy liquidity winds at its back there is no telling when this rally will end. Enjoy the ride while it lasts.
Price action on the S&P 500 remains bullish and still in the narrow trend channel we drew in several weeks ago. Moving average convergence/divergence (MACD) is still on a buy signal but looks to be overbought, and stochastics are embedded, which means any dip is being purchased by the "pros," or the dip buyers. It is hard to find a spot where there markets are going to test support when dip buyers are this active.
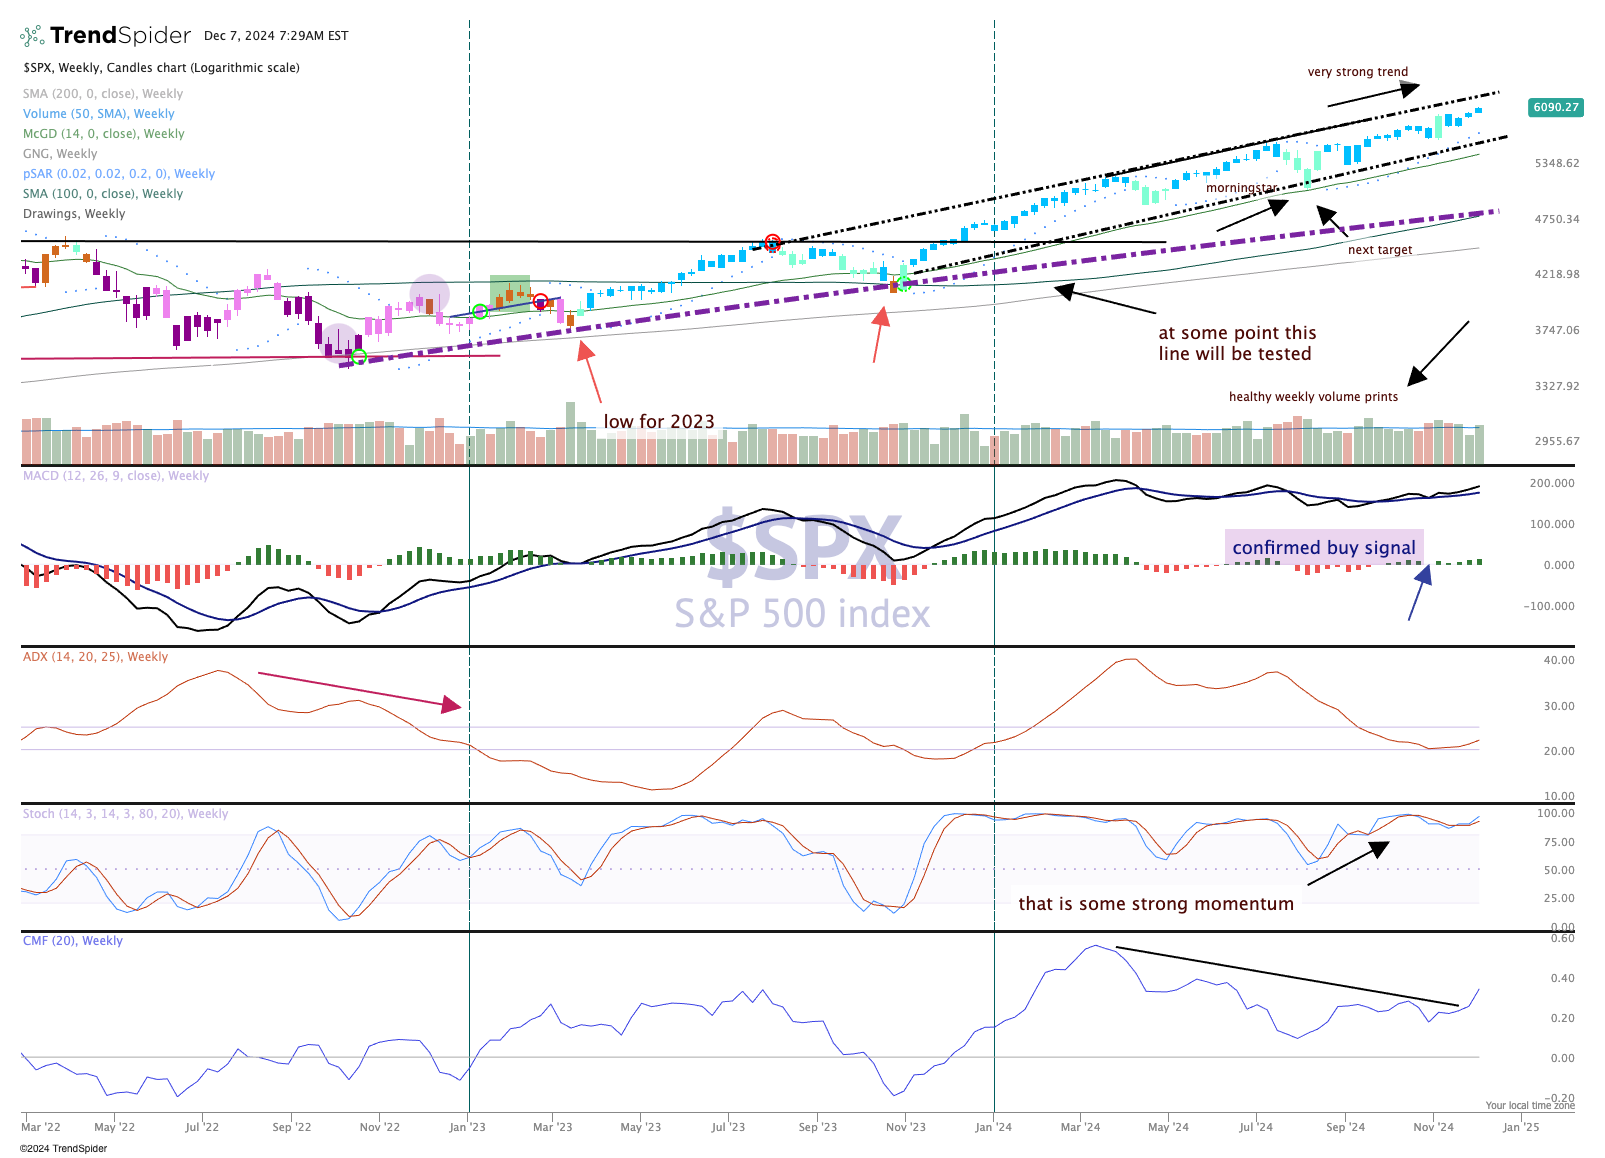
Money flow at the bottom has just turned up, proving the big institutional money is active in buying stocks. It has been awhile since the indicators on this weekly chart have all lined up with the price action, but that is what we have. Moving up!
