The Mag 7 Stock That Could Break Out
The breadcrumbs are there. Here’s my plan to follow them.
You've reached your free article limit
You've read 0 of 1 free Pro articles.

I’m still in two Magnificent Seven stocks. Those would be Amazon (AMZN) and Microsoft (MSFT). However, one of those, at this moment, is postured quite bullishly, at least technically. That’s my opinion and I’m invested in the shares.
This piece is about Microsoft. Let’s check out the charts.
First, readers should be cognizant that second-quarter earnings reporting season will kick off in earnest next week when the big U.S. banks go to the tape with their results. The so-called Magnificent Seven has struggled of late relative to the broader marketplace in terms of share-price performance as well as in terms of free cash flow generation thanks to exploding capex costs.
Microsoft shares are now down 20.7% year to date and down 31% from their mid-2025 high. CEO Satya Nadella’s company is expected to report in late July. There has not yet been an official announcement on a date, but Microsoft last reported on April 29.
Wall Street is currently looking for adjusted EPS of $4.24 on revenue of almost $88 billion. If these numbers are close, they would be good for year-over-year growth of 16% (earnings) and 15% (sales) respectively, which is rather robust for a mega-cap stock such as Microsoft.
The Chart
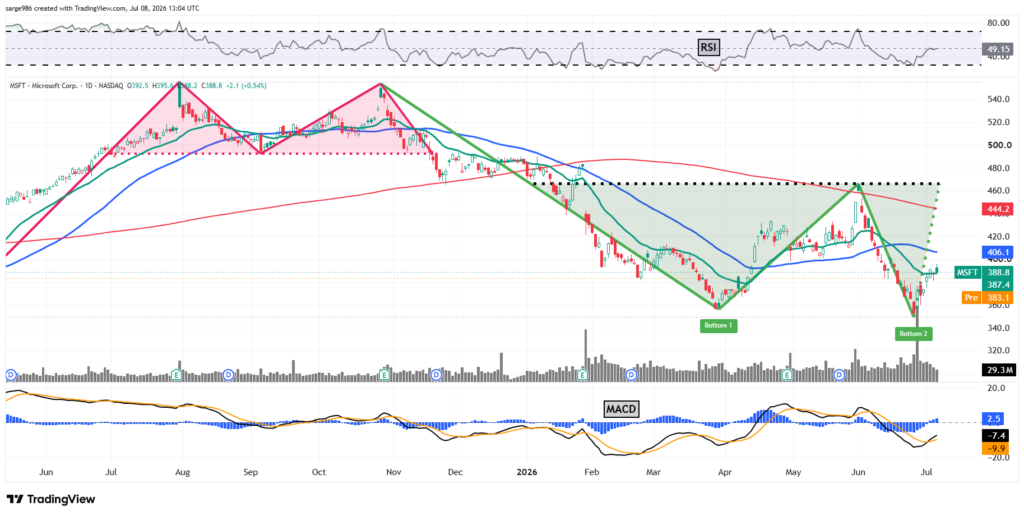
Readers will note that Microsoft has behaved over the past year exactly as a market technician might have expected. I am not saying that I traded MSFT perfectly over the past year (rather well, actually), but I am saying that the breadcrumbs were there, and the path could have been seen without a ton of difficulty.
The shares came out of a Double Top pattern of bearish reversal that worked like a charm just ahead of the Thanksgiving holiday. Now, suddenly, these shares appear to be in the process of completing a Double Bottom pattern of bullish reversal.
Could this be the positive setup that MSFT specifically and perhaps mega-caps more broadly need so badly? No promises, but those breadcrumbs are there.
The upside pivot here would be the $466 peak of the central part of the big “W” or Double Bottom pattern. To get there, the shares are currently engaged in a battle close to the 21-day exponential moving average (EMA). Whether or not MSFT can take and hold that level will likely be up to the swing crowd more than the pros.
What will matter to professional managers will be the 50-day simple moving average (SMA) ($405), 200-day SMA ($443) and then that pivot. Those lines are where the professional money has to make decisions regarding allocation. That’s a lot of potential traffic. Resistance? Maybe. Fuel for a fire? Possibly that too.
Looking at my most commonly relied upon indicators, Relative Strength is close to retaking the neutral line. Below the chart, the daily moving average convergence divergence (MACD) is looking much better. The histogram of the 9-day EMA is now in positive territory, which is a short-term bullish signal. On top of that, the 12-day EMA is now running above the 26-day EMA. That’s a bullish signal, which is somewhat muted due to the fact that both of those lines are still in negative territory.
My Plan
Price Target: $565
Pivot: $466
Add or Initiate: Here & Now
Panic: 8% loss
At the time of publication, Guilfoyle was long AMZN and MSFT equity.
