Chart of the Day: This Holding's Chart Says Better Times Are Ahead
The stock moved out strong above resistance last week and is sustaining that move.
You've reached your free article limit
You've read 0 of 1 free Pro articles.
What is not to like about the Bank of America BAC? The chart shows a massive breakout on volume that started the day after the election was settled.
Take a look at that volume bar. It is very impressive. This indicates heavy buying by institutions that even added as the stock was moving upward. When demand is strong like this, there is nowhere to go but up (at least for a time).
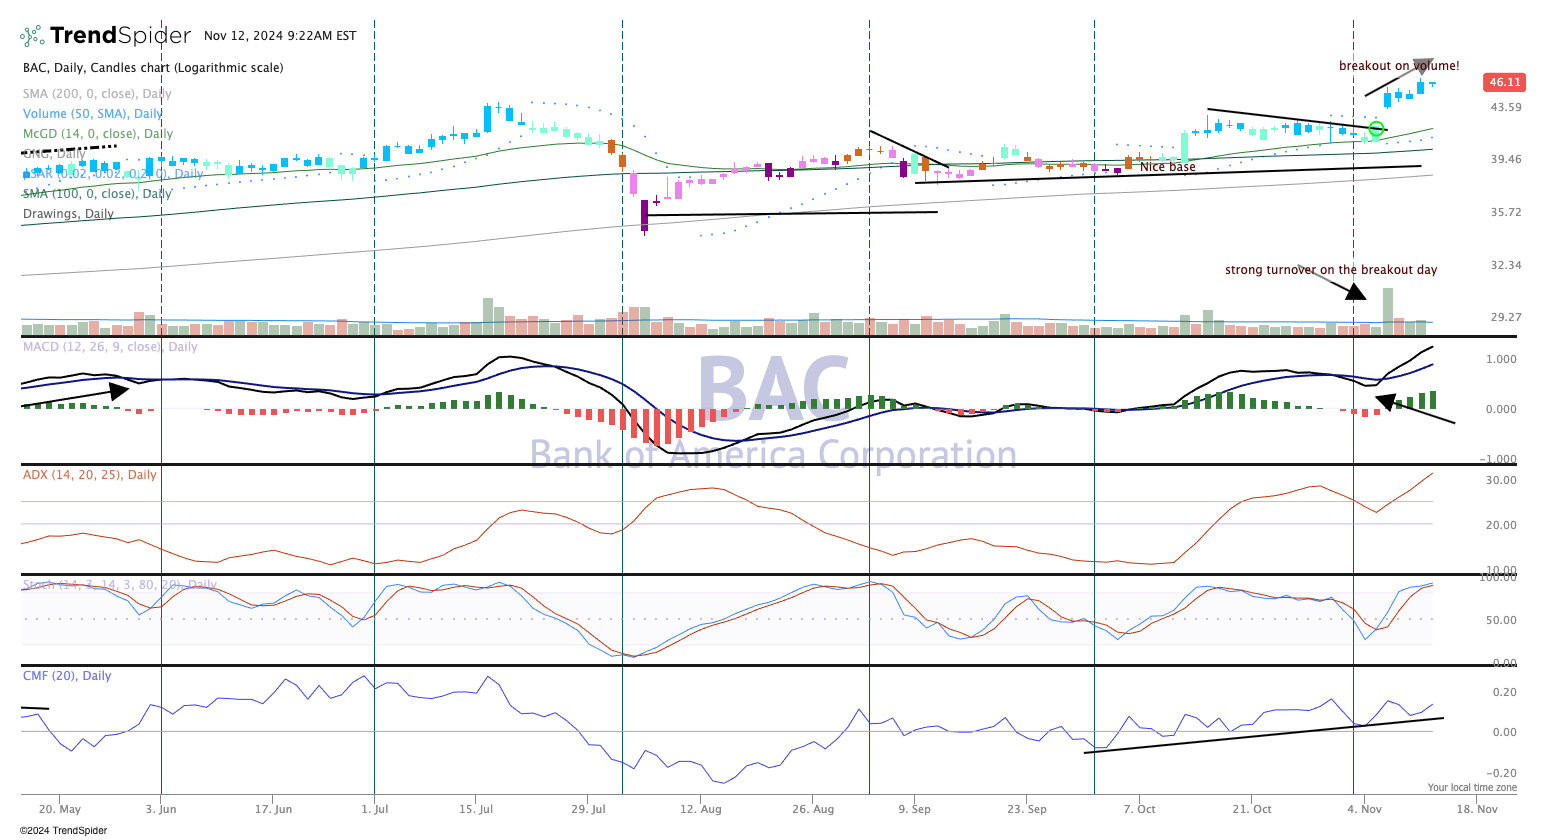
Indicators are also bullish. Notice the smooth move up in the money flow (bottom pane), Moving Average Convergence Divergence (MACD) crossed over last week for a buy signal while ADX (pane 3) is above 30, which indicates a very strong trend is present.
At current levels, BAC is at January 2022 prices, so a bit of supply (sellers) may hit the stock and knock it down. If not or just a mild move, we see this stock making a run to the $50's over the next few months.
We like Bank of America and rate it a One in TheStreet Pro Portfolio.
More Pro Portfolio:
- We're Closing Out This High-Flying Position With a Triple-Digit Gain
- Weekly Roundup: A Big Week for the Market, But Caution Lights Are Flashing
- In Case You Missed It: Reports That Held Clues for Our Holdings Amid Busy Week
At the time of publication, TheStreet Pro Portfolio was long BAC.
