TheStreet Pro
HOME
PORTFOLIO
HomeHoldingsActionAnalysisForum
DAILY DIARY
TRADE IDEAS
MARKETS
Most Active StocksTop Stock GainersTop Stock LosersPre-Market Gainers & LosersAfter-Hours Gainers & LosersEarnings Calendar
LATEST
Latest NewsMarket CommentaryInvestingTechnical Analysis
VIDEOS
AUTHORS
All AuthorsDoug KassHelene MeislerRev SharkStephen GuilfoyleChris VersaceJason MeshnickWatchlist
PORTFOLIOHomeHoldingsActionAnalysisForum
TheStreet Pro

PORTFOLIO

  • Home
  • Holdings
  • Action
  • Analysis
  • Weekly Roundup

LATEST

  • Home
  • Technical Analysis
  • Trade Ideas
  • Market Commentary
  • Investing
  • Dividends
  • Options
  • Earnings

FEATURED AUTHORS

  • Chris Versace
  • Stephen Guilfoyle
  • Helene Meisler
  • Doug Kass
  • Carley Garner
  • More Authors

MORE

  • Daily Diary
  • Top Stocks
  • Columns
  • Watchlist

© 2026

Site MapTerms of UsePrivacy PolicyMarket HolidaysFAQCustomer Service

More News from TheStreet Pro

  • Of All Post-Earnings Worries, This One Keeps Me Up at Night

    BY Bret Jensen · Aug 17, 2026, 12:35 PM EDT

  • A Small-Cap Stock Is Offering an Opportunity — And Almost Nobody Is Covering It

    BY James "Rev Shark" DePorre · Aug 17, 2026, 11:40 AM EDT

  • Our All-Stars Basket Crosses into the Black

    BY Chris Versace · Aug 17, 2026, 11:19 AM EDT

  • Intel’s Chart Puts Out Some Bullish Signals as CEO Stocks Up

    BY Stephen Guilfoyle · Aug 17, 2026, 11:05 AM EDT

  • When Thinking About Rate Hikes, Something Just Doesn’t Compute

    BY Peter Tchir · Aug 17, 2026, 10:15 AM EDT

See More News from TheStreet Pro
Home>portfolio
portfolio

Chart of the Day: This Holding Reaches Prime Spot to Add More Shares

A short-term technical tool points to a new opportunity for this Portfolio holding.

Bob Lang·Dec 9, 2024, 1:35 PM EST

You've reached your free article limit

You've read 0 of 1 free Pro articles.

Unlock unlimited Pro access — 50% off Today. Offer Ends soon
Already registered or a Pro member? Log in

One of the short-term technical tools that we favor is the McGinley Dynamic (MD), examined over 14 periods. It is a bit different than relative strength indicators as the MD adjusts for shifts in market speed. The McGinley Dynamic indicator attempts to solve a problem inherent in moving averages that use fixed time lengths. 

The basic problem is that the market, being the great discounting mechanism that it is, reacts to events at a speed that a moving average will not be able to cope with. We won't get into the specifics of the formula, but it is a reliable indicator.
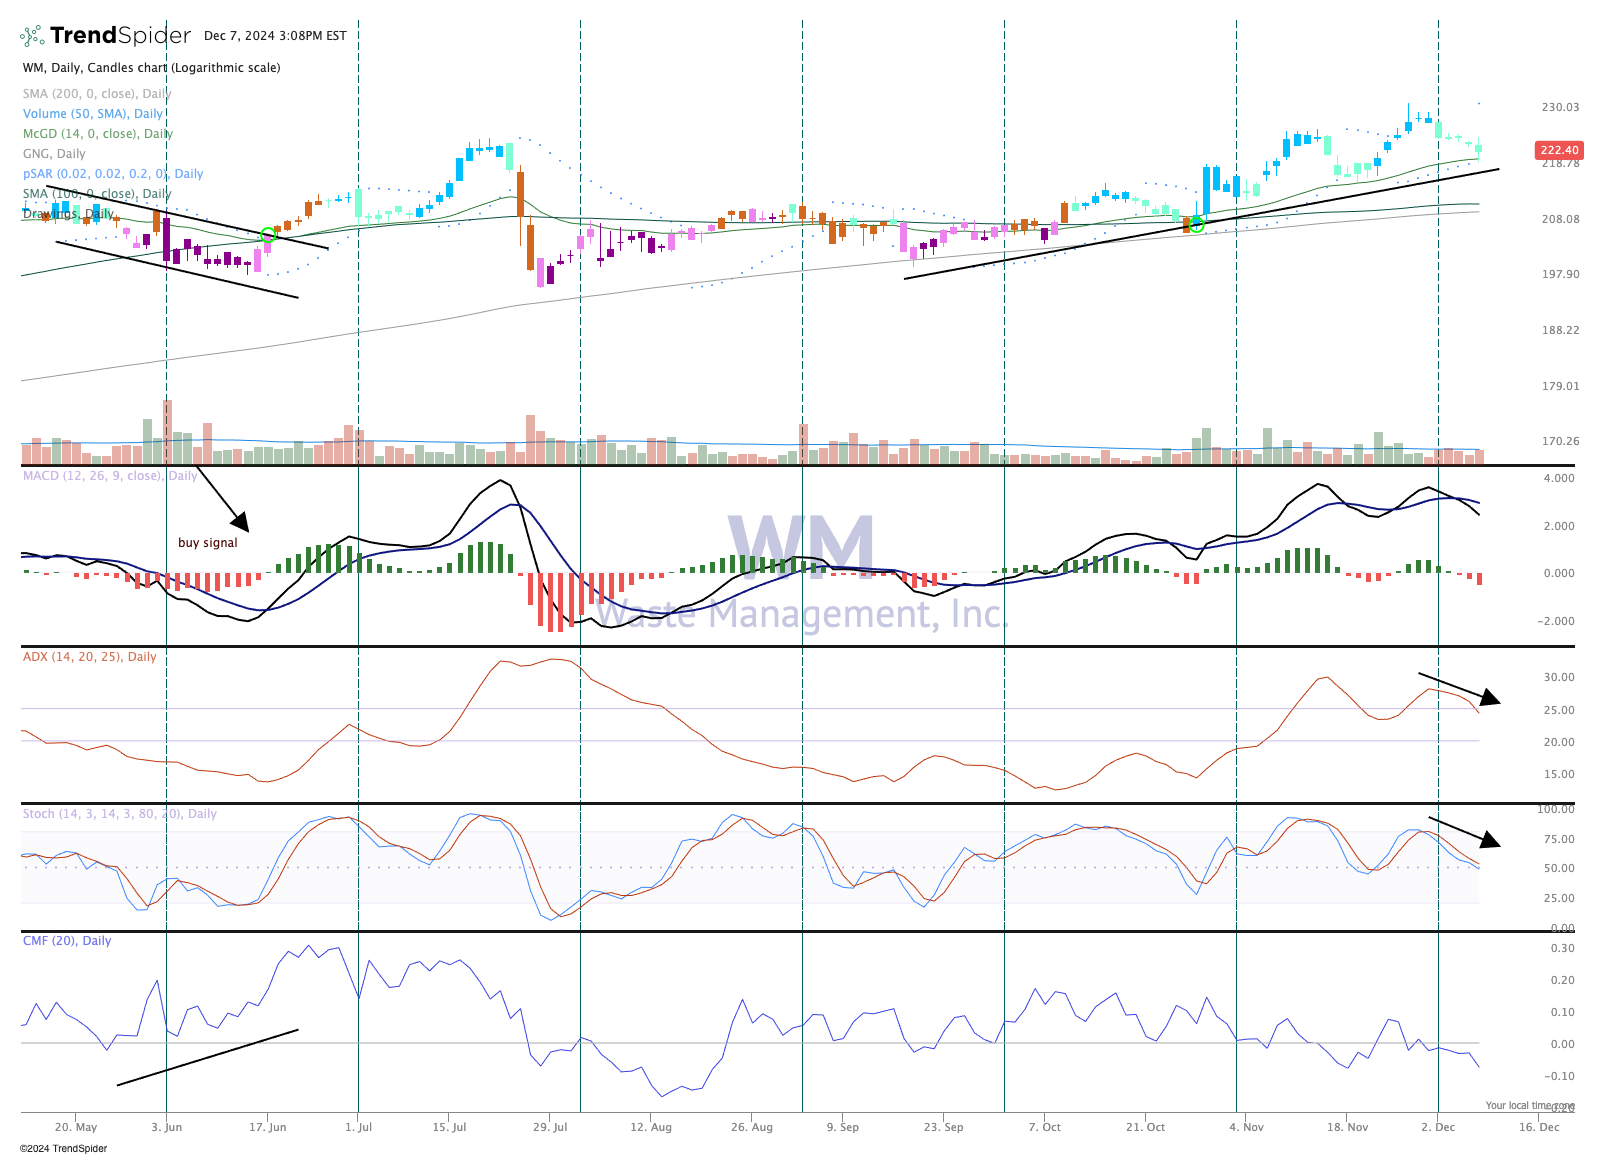
The chart of Waste Management WM shows the stock is once again bouncing off the MD, much like it did twice in November and flirted with for most of the early part of fall. While one indicator does not suffice for a pristine analysis, we should use others to create a narrative for stock moves. The MACD is pointing down here, as is stochastics, money flow and the ADX.  

However, these bearish conditions were present the prior few times WM was at the MD line, then bounced sharply. We'll take our cues from historical precedent, Waste Management is in a good spot for you to add more shares.

We like WM here and rate it a two in TheStreet Pro Portfolio.

More Pro Portfolio

  • We're Locking In a Triple-Digit Gain for This Deeply-Overbought Name
  • Weekly Roundup: A Lack of Fear Is Concerning as the Market Melts Up
  • Half of U.S. Living Paycheck to Paycheck — and More Headlines You Might Have Missed

At the time of publication, TheStreet Pro Portfolio was long WM.

Bob Lang

By Bob Lang