Chart of the Day: This Holding Is Heading Toward a Major Support Level
Several layers of support may hold the price at the next junction.
You've reached your free article limit
You've read 0 of 1 free Pro articles.
Labcorp Holdings LH is still in correction mode after peaking in the early part of November. Notice the subtle and slow change in the candle colors in the top pane of the chart below.
The GoNoGo composite of indicators indicates the chart is neutral (amber color), but having moved from blue to amber quickly tells us we are likely to see bearish colors (pink/purple) soon if the trend down continues.
The long-term uptrend is still intact. We could see a nice bounce off the drawn trendline or even the 200-day moving average sitting just below at around $215. That would be a great spot to add more stock
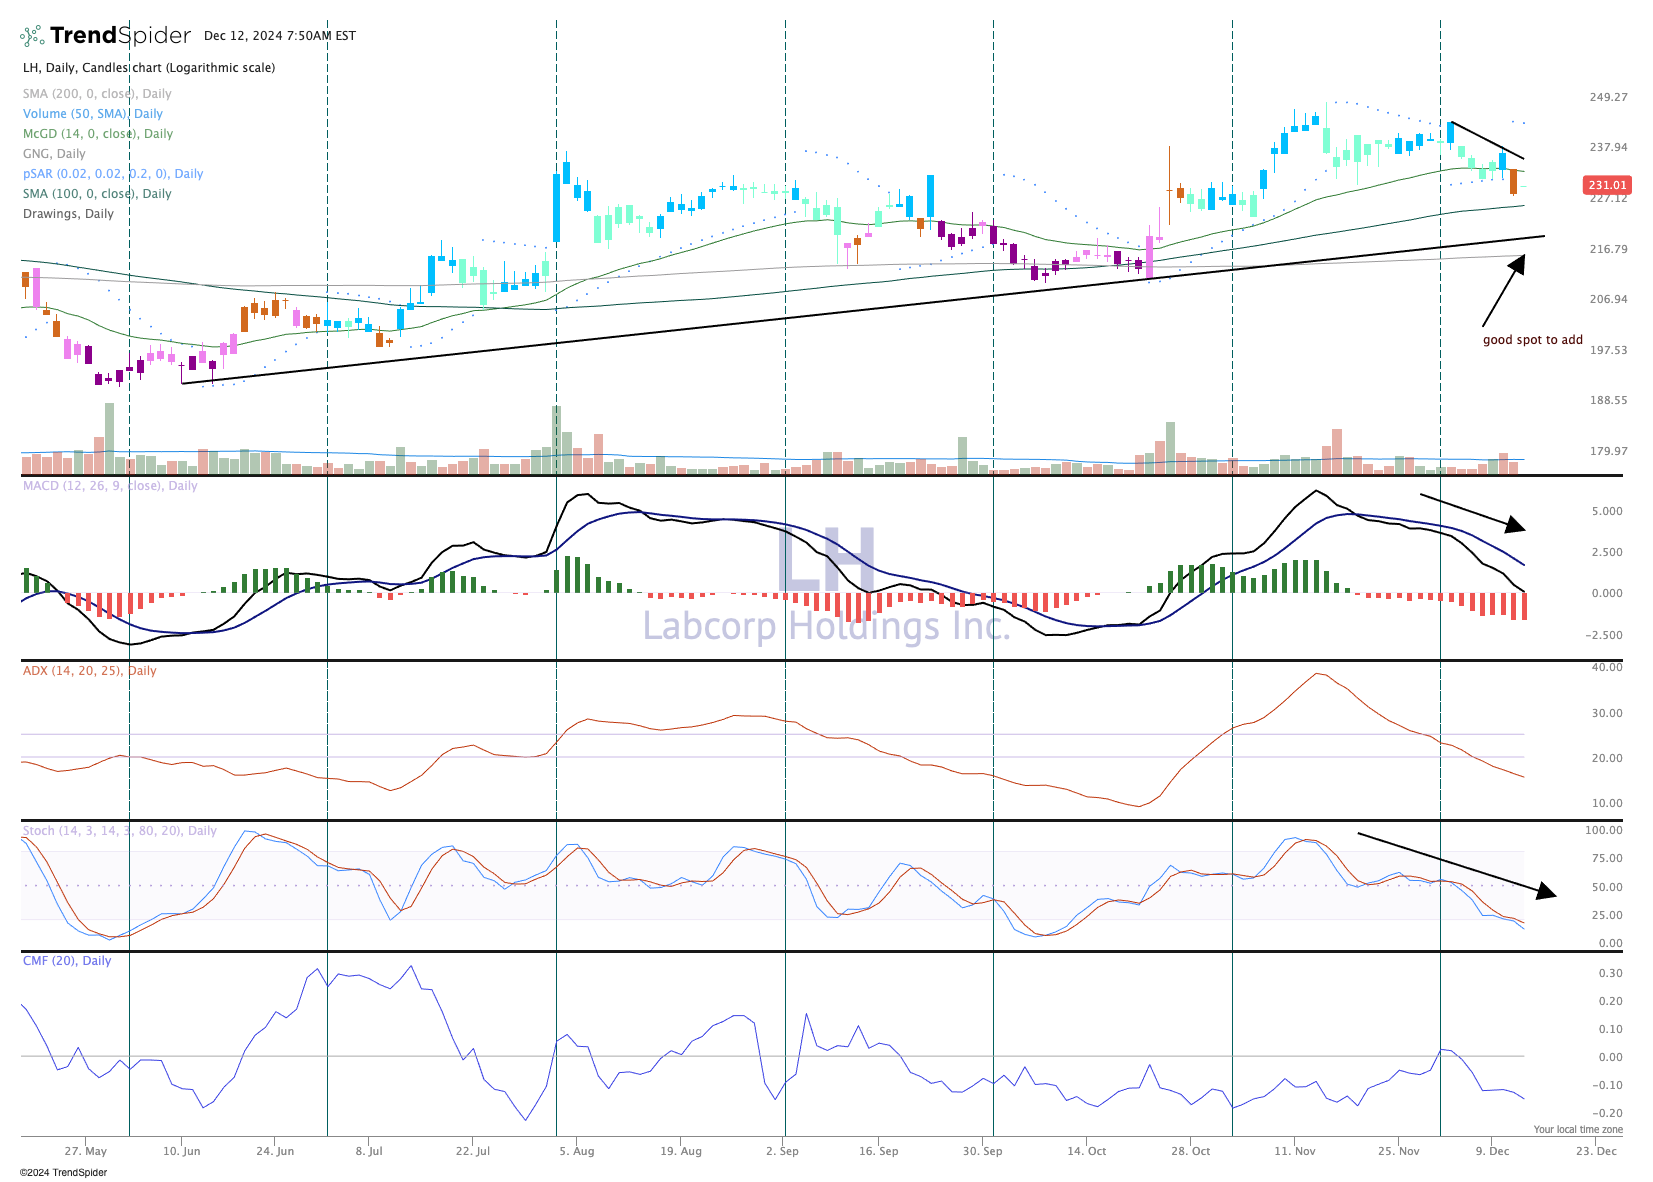
The indicators are bearish. MACD (moving average convergence/divergence) is still on a sell signal and the ADX has shifted down and is bearish. Meanwhile, the momentum in the stock is negative, and the stochastics in pane 4 are pointing down. Money flow at the bottom is also weak.
The positive takeaway is if LH can bounce off the support (arrow) then a higher low is created on the chart, which keeps the uptrend in place.
We like LH and rate it a Two in TheStreet Pro Portfolio.
More Pro Portfolio: (updated Dec. 8)
- We're Locking In a Triple-Digit Gain for This Deeply-Overbought Name
- Weekly Roundup: A Lack of Fear Is Concerning as the Market Melts Up
- Half of U.S. Living Paycheck to Paycheck — and More Headlines You Might Have Missed
At the time of publication, TheStreet Pro Portfolio was long LH.
