Chart of the Day: The Trade Desk Tests Key Trendline
The stock made a big run to resistance and backed off, can it punch through one more time?
You've reached your free article limit
You've read 0 of 1 free Pro articles.
Last time we looked at The Trade Desk TTD on Nov. 7, the stock was starting to break out on volume. On that day, we recognized the overbought condition but also theorized this stock could really make a move. That happened, but more recently the stock has burned off some of the overbought condition and is testing a major trendline.
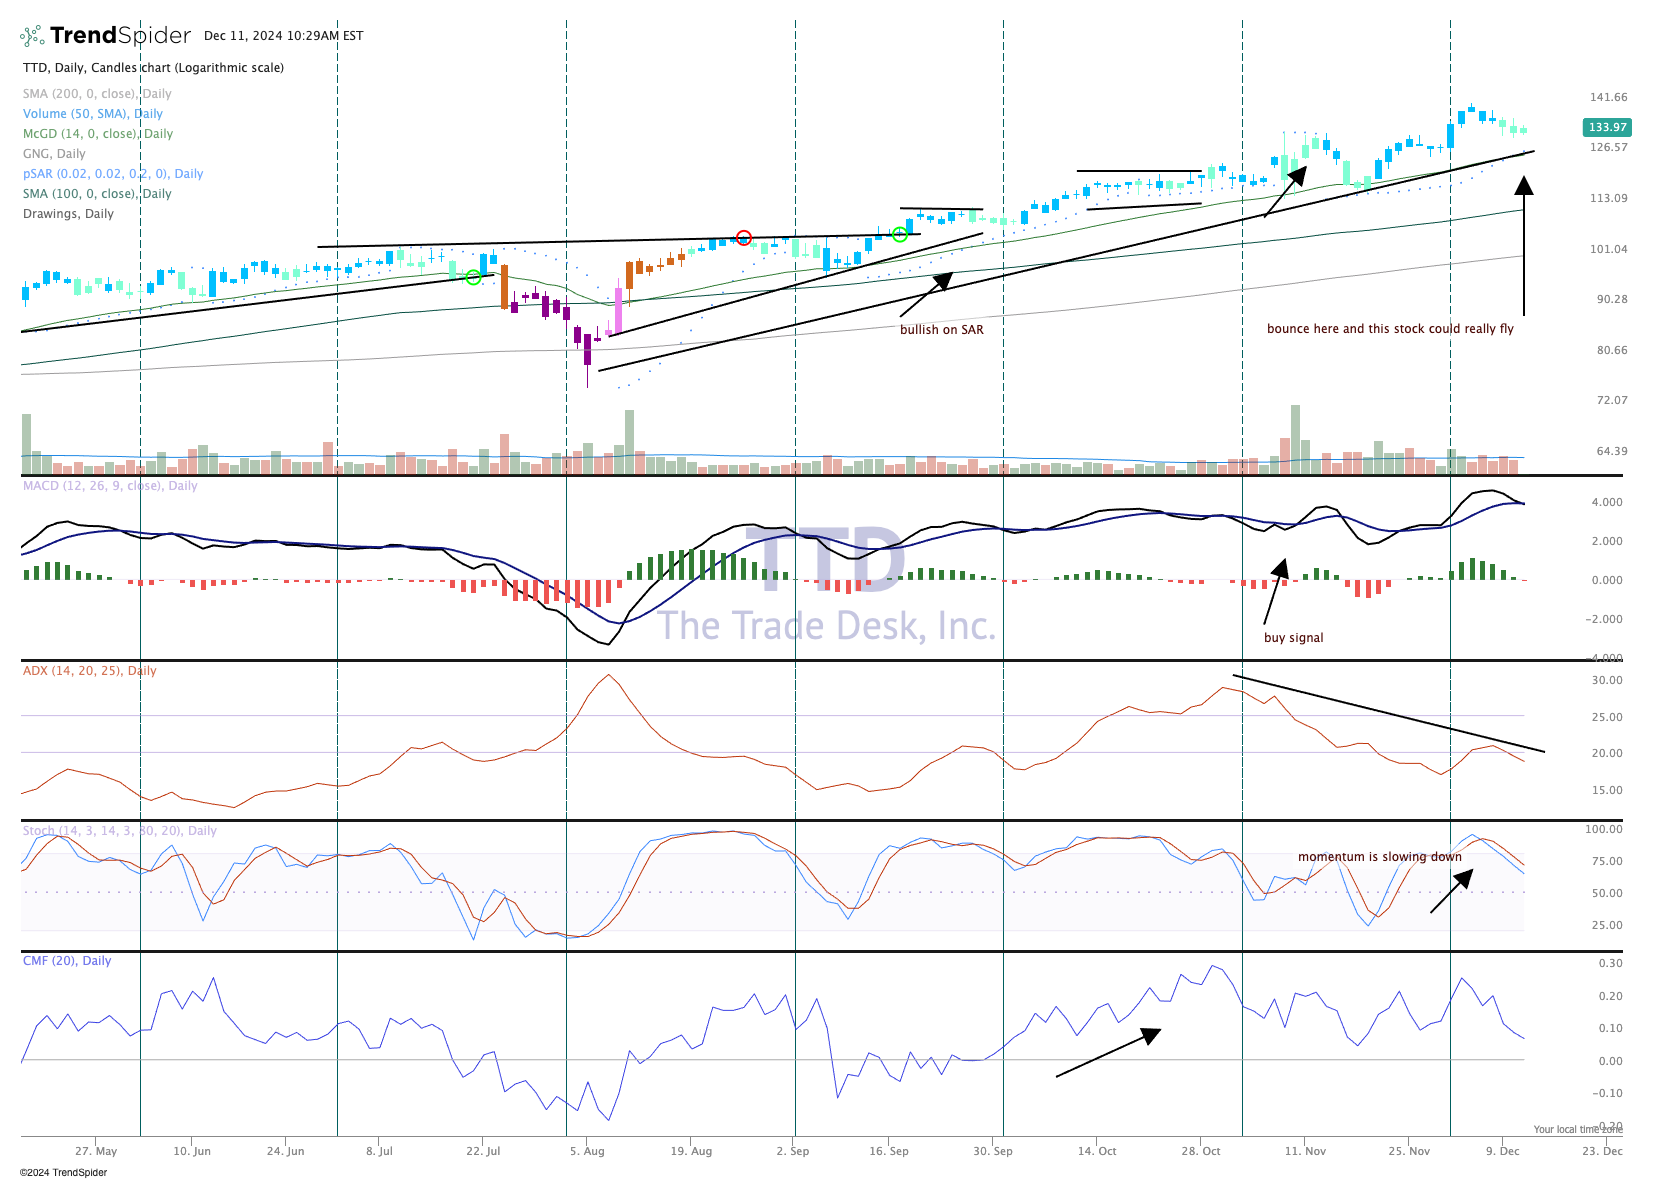
That is constructive, remember a textbook uptrend has higher-highs, higher-lows. We find that in the TTD chart, a brief pullback would be a nice place for the stock to reset and make its next move, probably higher. We could see a run to $150 before long.
The indicators are not bullish right here, but that makes sense, because the stock has pulled back. But notice in the top pane, the candles are teal, which is still cautiously bullish. The last couple of times the candles went from blue to green they moved right back to blue (strong bullish) quickly, according to the GoNoGo composite of indicators, also in the top pane.
We like The Trade Desk and rate it a two in TheStreet Pro portfolio, stockpile on pullbacks.
At the time of publication, the Pro Portfolio was long TTD.
