Chart of the Day: A Tech Position Trends Higher Ahead of Earnings
The price action, volume and indicators are all bullish and look inclined to stay that way.
You've reached your free article limit
You've read 0 of 1 free Pro articles.
Typically a stock like The Trade Desk TTD will not move too much before an earnings announcement. In the options market, implied volatility takes care of that by telling investors and traders that if they want to play, they have to pay.
What does that mean?
The market shows a large "expected move" based on historical volatility into an event like earnings, and when it is completed, the volatility moves back to normal.
The Trade Desk will report earnings Thursday after the close of trading.
In the case of TTD, there is a high implied volatility in the options market as trader demand swells, looking for an "outsized" move. The market is expecting a move of $12 (up or down), or 9.8% the price of the stock. That is a big move, but it has happened before.
So, where is the edge in trying to be on the right side of history? We look to the chart, realizing full well there is no guarantee, rather we play the odds of historical moves that tend to repeat over and over again.
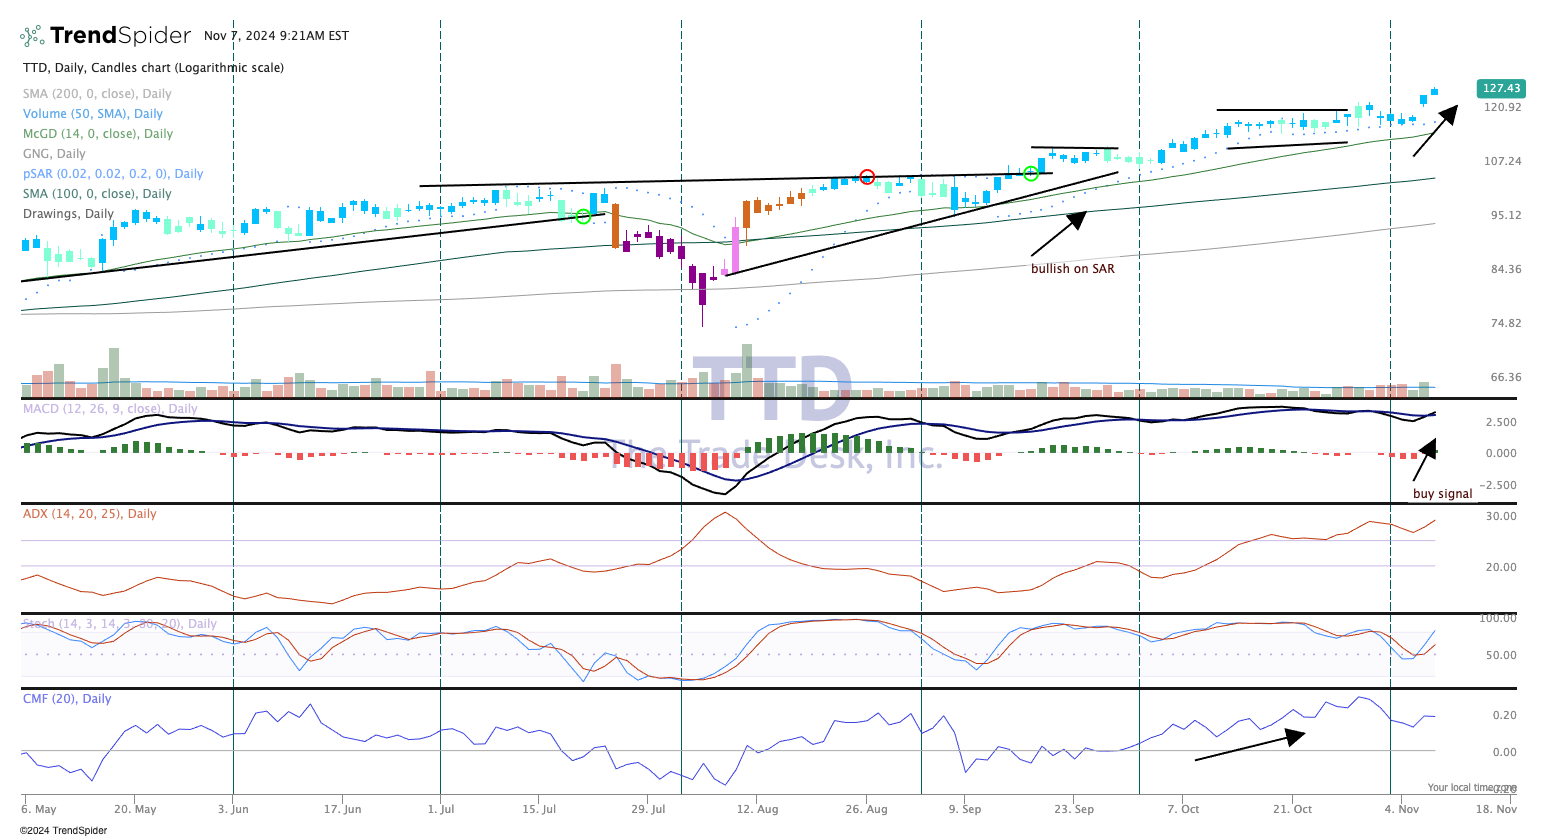
The chart shows a series of higher-highs, higher-lows since an interim bottom in July. That is our textbook definition of an uptrend.
In the top pane, the candles are blue, which is a strong bullish condition in the GoNoGo composite of indicators. Stochastics have turned up too, so there is strong momentum. We added the ADX, or average directional movement, in pane 3, which is making higher-highs, higher-lows.
With the sharp increase in price lately it is possible good news is being priced in, but with some of the moves lately in stocks that beat expectations, don't be surprised if TTD pulls off a massive move up.
We like The Trade Desk and rate it a "Two" in TheStreet Pro Portfolio, or stockpile on pullbacks.
At the time of publication, TheStreet Pro Portfolio was long TTD.
