Chart of the Day: This Holding Hits Resistance
This name we've held for awhile has been a strong mover lately, but it's now overbought in the short term.
You've reached your free article limit
You've read 0 of 1 free Pro articles.
Stocks reaching new all-time highs when the markets are doing the same is a strong signal of bullish quality. Such is the case for The Trade Desk TTD, which has moved up and over heavy resistance to print a new high.
That was roughly the $110 level, where TTD had some issues trying to mount a surge. Recent volume trends have been positive and bigger volume days on the up sessions is very bullish.
The technicals on the chart are mixed though, but the price action is not. It is extremely bullish, the parabolic stop and reverse (SAR) along with the MACD are on strong buy signals. Notice in the price chart that the candles are blue — that is bullish on the GoNoGo composite of indicators. We also see every pullback since August has been a buying opportunity.
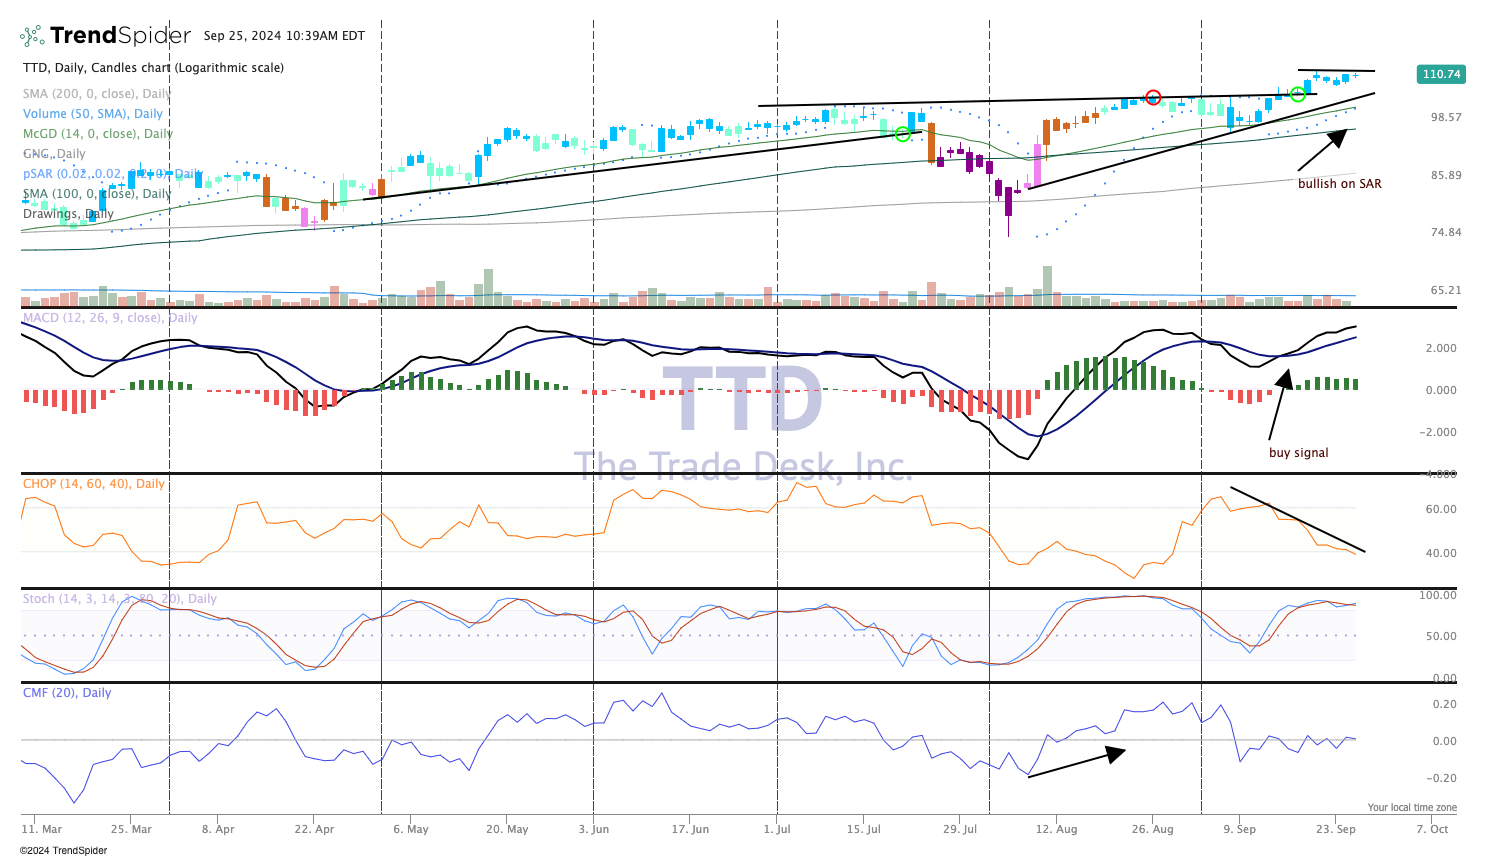
A couple of closes above $112 would be very positive for the stock and a move to $120 or so would be next.
We recently sold some shares, however, locking in gains to raise a bit of cash. We have been in this name for awhile and it was time to book some gains, we hope you did as well.
We rate TTD a one in TheStreet Pro Protfolio, buy at anytime.
More Pro Portfolio
- Buying More Stock of This Semi-Cap Equipment Position
- Weekly Roundup: Is the Market Setting Up for an April Repeat?
- The AI Conundrum, Cyber Threats, and Our Digital World: More News on Our Strategies
At the time of publication, TheStreet Pro Portfolio was long TTD.
