Chart of the Day: Morgan Stanley's Breakout Is a Thing of Beauty
Strong price action amid higher volume means this move is sustainable.
You've reached your free article limit
You've read 0 of 1 free Pro articles.
There is nothing like a strong breakout on higher volume to confirm your conviction in a stock move. That has been the case with Morgan Stanley MS.
Following a recent drop that tested the 200-day moving average (just prior to earnings), Morgan Stanley bounced sharply off that level and rose up on some heavy volume (arrows in top pane).
We see the candles quickly change from bearish to bullish (pink to teal to blue) in the GoNoGo indicator, a very strong move driven by institutional buying and short-covering.
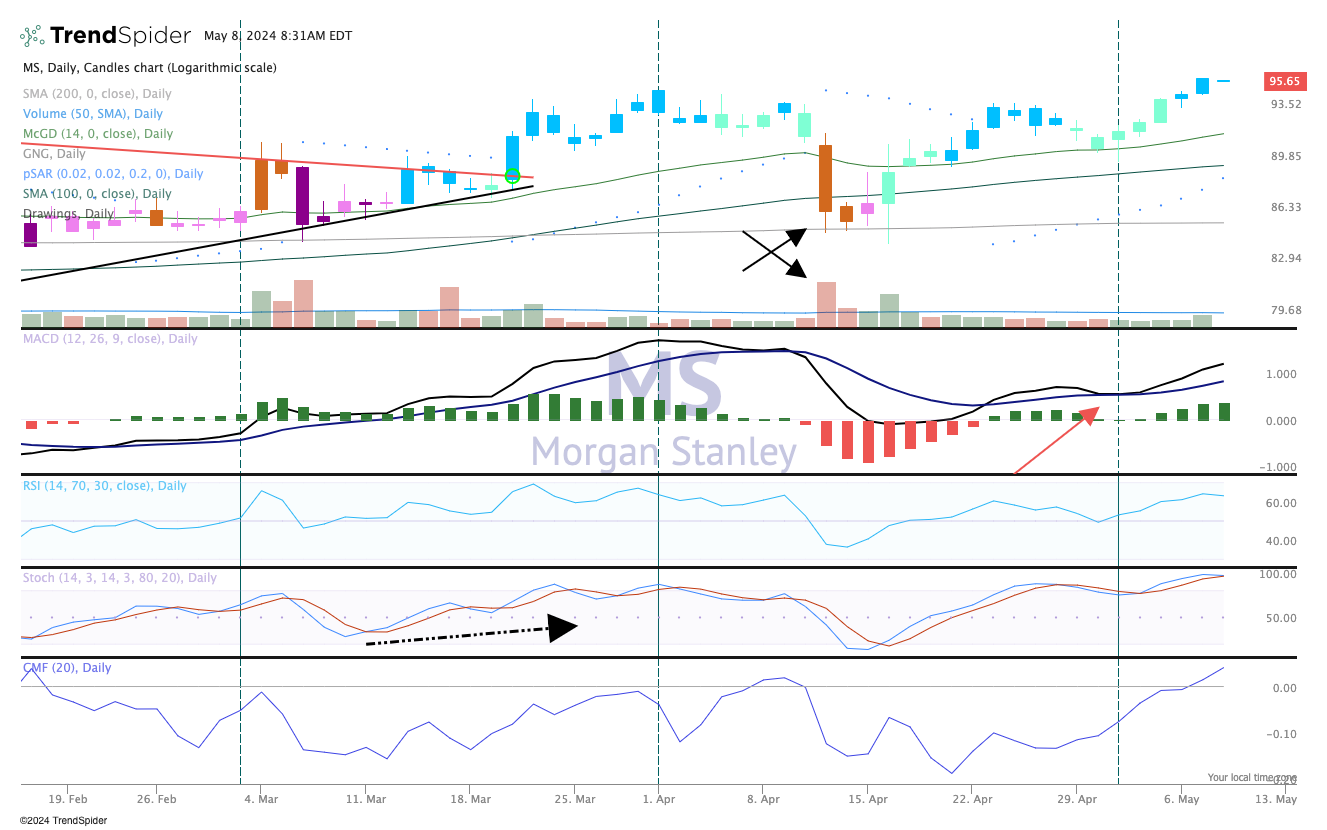
The chart shows a textbook pattern of higher highs, higher lows in place. That is bullish. MACD (moving average convergence divergence) is also on a buy signal having crossed bullishly at the beginning of the month.
Some had raised concerns over the poor stock performance just after earnings, but as patient investors we saw the strength coming and simply waited. The stock is up more than 12% since reporting their last quarterly result in mid-April.
Stochastics are overbought here and Chaikin money flow (bottom pane) has just turned positive. We could see some sideways action here for the next few weeks followed by a run to $100 or higher. We picked up more of the stock in the $84 area back in February.
We rate Morgan Stanley a Two in TheSstreet Pro portfolio, or stockpile on pullbacks.
At the time of publication, TheStreet Pro Portfolio was long MS.
